In today’s rapidly evolving digital world, data is everywhere, and the ability to extract valuable insights from it is essential for businesses and organizations. Statistics is the backbone of data science, providing powerful tools for analyzing data, interpreting trends, and making informed decisions. According to Forbes, a report by IDC stated that the global data sphere is expected to reach 175 zettabytes by 2025. With such vast amounts of data, understanding statistical principles is crucial for professionals in the field of data science.
In this article, we will explore key statistical concepts and their applications in data science. We’ll cover both fundamental and advanced statistical techniques, as well as the most commonly used software tools. Whether you’re new to the field or looking to refine your expertise, this guide will provide a comprehensive overview of how statistics is used to turn raw data into actionable insights.
Fundamentals of Statistics
Descriptive Statistics
Descriptive statistics provide simple summaries of data and help data scientists make sense of large datasets. These statistics are used to organize and describe the characteristics of the data, focusing on:
- Measures of Central Tendency: These include the mean (the average value), median (the middle value), and mode (the most frequent value). For example, if a company collects customer feedback scores, the mean would provide the average satisfaction rating across all customers.
- Measures of Dispersion: Dispersion refers to how spread out the data is. Common measures include the range (difference between the highest and lowest values), variance (how much the data varies from the mean), and standard deviation (the average amount each data point differs from the mean). Understanding dispersion helps to assess the volatility or consistency of data.
Inferential Statistics
Inferential statistics allow data scientists to make predictions or generalizations about a population based on a sample of data. This is especially important in data science, where complete datasets are often too large to analyze:
- Population and Sample: The population represents the entire dataset, while a sample is a smaller subset used to draw conclusions about the population. For example, in a medical study, testing a sample of patients rather than the entire population is more practical.
- Estimation and Hypothesis Testing: Estimation involves predicting population parameters based on sample data. Hypothesis testing assesses whether a hypothesis about a population is likely to be true. Statistical tests, such as t-tests or chi-squared tests, help in validating hypotheses. For instance, a hypothesis test could help determine whether a new marketing campaign has statistically significant effects on sales.
Why Does Statistics Matter in Data Science?
Statistics is integral to the entire data analysis pipeline. It provides the framework for collecting, analyzing, and interpreting data, ultimately enabling data scientists to derive meaningful insights that can be used for decision-making.
Data science relies heavily on statistical methods to analyze datasets and discover patterns or relationships. For example, statistical algorithms can help a retailer predict which products are likely to sell the most during certain seasons. By analyzing past sales data and using regression models, businesses can forecast future trends and stock inventory accordingly. Without statistics, drawing conclusions from such vast amounts of data would be nearly impossible, and the decisions made would be far less informed.
Additionally, statistics help ensure that decisions are based on empirical evidence, reducing the risk of bias. In machine learning, for instance, statistical tests are used to measure the accuracy of predictive models. This leads to more reliable insights and ultimately more effective strategies for problem-solving across a wide range of industries, from healthcare to finance.
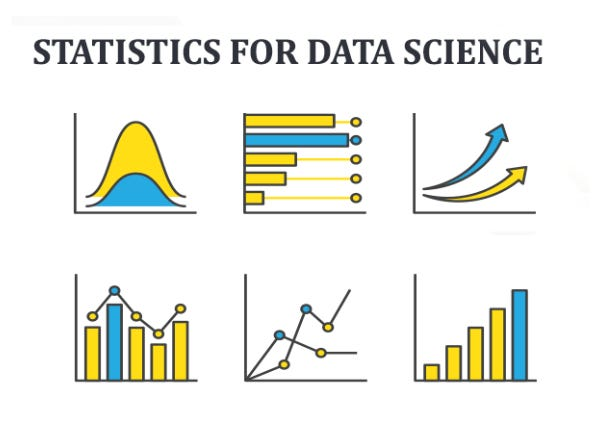
Fundamental Statistics Concepts for Data Science
Source: GeeksforGeeks
Correlation
Correlation measures the strength and direction of the relationship between two variables. A positive correlation means that as one variable increases, the other does too, while a negative correlation means that one decreases as the other increases. For example, in an e-commerce setting, there may be a strong correlation between the number of website visitors and total sales. Correlation coefficients range from -1 to 1, with values closer to 1 indicating a strong positive relationship. However, it’s important to remember that correlation does not imply causation.
Regression
Regression is a predictive modeling technique that estimates the relationships among variables. The two main types are linear regression, which predicts continuous outcomes, and logistic regression, which is used for binary outcomes (e.g., yes/no decisions). For example, linear regression might be used to predict future sales based on historical data, while logistic regression might be used to determine the likelihood of customer churn based on user behavior.
Bias
Bias refers to systematic errors that can affect the validity of statistical analysis. There are various types of bias, such as sampling bias (where the sample is not representative of the population) and confirmation bias (where data is interpreted to confirm pre-existing beliefs). Recognizing and correcting for bias is essential to ensure accurate, reliable results in data science.
Event
In statistics, an event is a set of outcomes to which a probability is assigned. In the context of data science, an event could be anything from a customer making a purchase to a system failure in a machine learning application.
Statistical Analysis
Statistical analysis involves applying mathematical techniques to interpret data. Key techniques include clustering (grouping data based on similarities), classification (predicting categorical outcomes), and dimensionality reduction (simplifying data without losing essential information).
Normal Distribution
The normal distribution, or bell curve, is a common probability distribution in statistics where most data points cluster around the mean. It is important in data science for making predictions and inferences, as many statistical methods assume normal distribution.
Statistical Software Used in Data Science
Excel
Excel is a foundational tool in data science for small to medium-sized datasets. It offers powerful functions for summary statistics, data visualization, and even basic regression analysis. Many professionals use Excel as a starting point before moving to more advanced tools.
R
R is a dedicated statistical computing environment that excels in handling large datasets and conducting advanced analytics. With packages like ggplot2 for data visualization and caret for machine learning, R is widely used for academic research and industry applications.
Python
Python has become the go-to language for data science due to libraries like Pandas for data manipulation, NumPy for numerical operations, and SciPy for advanced statistical analysis. Its simplicity and versatility make it a favorite among data scientists and engineers.
MySQL
MySQL enables the management and analysis of structured data using SQL queries. It is commonly used for querying large databases in data-driven applications and is essential for data extraction, transformation, and analysis in data pipelines.
SAS
SAS is a powerful software suite widely used in industries such as healthcare, finance, and government. It excels in advanced statistical analysis, including predictive modeling and multivariate analysis, and is renowned for its data security and reliability.
Jupyter Notebook
Jupyter Notebook is an interactive platform where data scientists can write and execute Python code. It’s ideal for exploratory data analysis, visualization, and sharing results, making it a popular choice for collaborative projects.
Advanced Statistical Concepts
- Probability:
Probability is a measure of the likelihood of an event occurring. It’s central to statistical modeling and is used in everything from risk assessment to machine learning. For example, probability can be used to predict the likelihood of customer churn in a subscription-based business. - Bayes Theorem:
Bayes’ theorem provides a way to update the probability of a hypothesis based on new evidence. It’s widely used in data science, particularly in fields like natural language processing (NLP) and spam filtering. For example, Bayesian models can help filter out spam emails by updating the probability of an email being spam based on certain words. - Probability Distributions:
Probability distributions describe how the values of a variable are distributed. Common distributions include the binomial distribution for binary outcomes and the normal distribution for continuous outcomes. Understanding distributions is key for making inferences from data. - Hypothesis Testing:
Hypothesis testing is used to determine whether a result is statistically significant. For example, in A/B testing, hypothesis testing can help determine whether a new website design leads to more conversions than the current design. - Parametric Tests:
Parametric tests, such as the Z-test, T-test, and ANOVA, are used when the data follows a known distribution. These tests help determine whether there are significant differences between groups or variables in a dataset.
Common Challenges in Statistical Analysis
- Dealing with Missing Data:
Missing data is a common issue in statistical analysis and can lead to biased results. Techniques like imputation (replacing missing values with estimates) or removing incomplete records are commonly used. For instance, in healthcare data, missing patient information could skew the results of an analysis. - Understanding and Correcting for Bias:
Bias can significantly affect the accuracy of your analysis. Identifying and correcting for bias is crucial. For example, in survey data, if certain demographics are underrepresented, the results may not be reflective of the population. Techniques like stratified sampling can help mitigate bias. - Interpreting Results Accurately:
Statistical results can sometimes be difficult to interpret, especially if there is a lack of context. Misinterpretation of results can lead to incorrect conclusions. It is important to understand the limitations of the data and analysis to draw valid conclusions.
Conclusion
Statistics is the foundation of data science, providing the tools and methodologies required to analyze and interpret data effectively. From basic concepts like correlation and regression to advanced techniques such as hypothesis testing and Bayesian analysis, mastering statistics is essential for success in data-driven fields. By utilizing powerful statistical software such as Python or R, data scientists can tackle complex problems and derive actionable insights. To continue improving your statistical skills, explore further resources and tools to stay ahead in the ever-evolving field of data science.