In machine learning, when building models for classification tasks (like predicting whether an email is spam or not), it’s important to evaluate how well the model performs. One of the most useful tools for doing this is the ROC curve. ROC stands for Receiver Operating Characteristic, and this curve helps visualize a model’s ability to distinguish between classes. It provides insights into the trade-offs between different classification thresholds.
The ROC curve is widely used because it offers a clear view of a model’s performance, especially when accuracy alone isn’t enough. Let’s dive into the details of how ROC curves work and why they are useful in machine learning.
Types of Classification Metrics in Machine Learning
Before understanding the ROC curve, it’s important to know some common metrics used to evaluate classification models. These metrics help assess different aspects of the model’s performance beyond just accuracy.
1. Confusion Matrix
A confusion matrix shows the breakdown of predictions made by the model, allowing us to see the number of true positives, true negatives, false positives, and false negatives:
- True Positive (TP): The model correctly predicted a positive case.
- True Negative (TN): The model correctly predicted a negative case.
- False Positive (FP): The model incorrectly predicted a positive case (a false alarm).
- False Negative (FN): The model incorrectly predicted a negative case (missed a positive).
2. Precision
Precision measures the proportion of positive predictions that are actually correct. It’s useful when you care about the accuracy of positive predictions.
3. Recall (Sensitivity)
Recall measures the proportion of actual positive cases that are correctly identified by the model. This is important when it’s critical not to miss any positive cases, such as in medical diagnoses.
4. F1-Score
The F1-score is a balance between precision and recall. It’s useful when you need to strike a balance between the two, especially in cases of imbalanced datasets where one class significantly outnumbers the other.
How Does a ROC Curve Work?
The ROC curve is a graphical representation that shows the performance of a classification model at different classification thresholds. Here’s how it works:
1. Plotting TPR and FPR
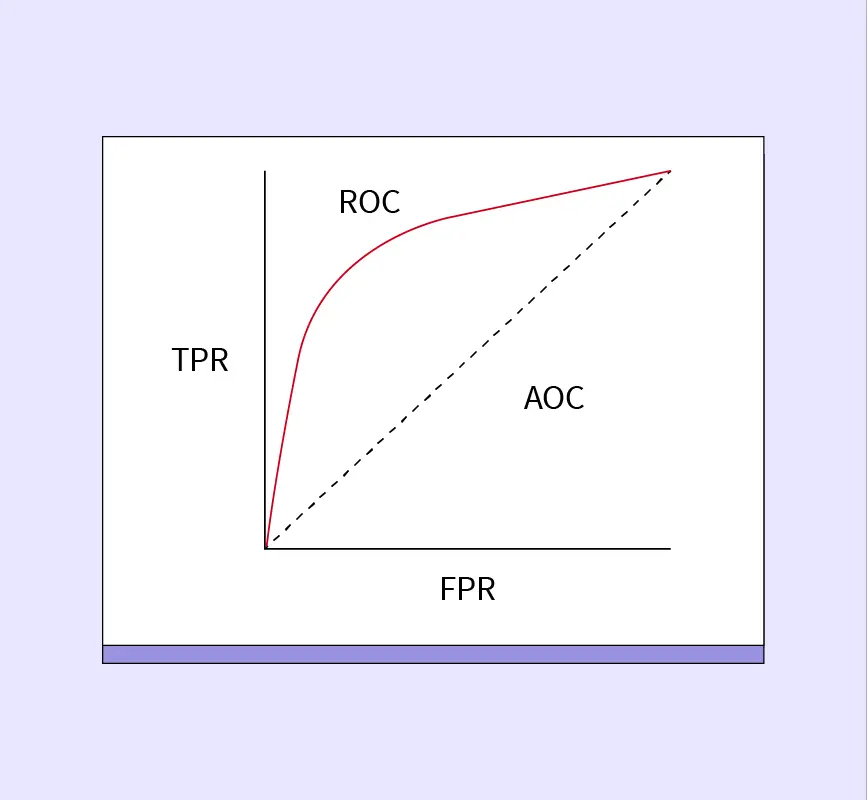
The ROC curve is generated by plotting the True Positive Rate (TPR) on the y-axis against the False Positive Rate (FPR) on the x-axis. Each point on the ROC curve represents a different classification threshold.
2. Thresholds and Their Impact
- A high threshold means the model is stricter about classifying positive cases, resulting in fewer false positives but also fewer true positives.
- A low threshold makes the model more lenient, increasing both true positives and false positives.
By adjusting the threshold, the model’s balance between TPR and FPR changes. This creates different points on the ROC curve.
3. Perfect Classifier
A model that can perfectly distinguish between positive and negative classes would have a point in the upper-left corner of the ROC space (TPR = 1, FPR = 0). The closer the ROC curve is to this point, the better the model performs.
4. Diagonal Line
If the ROC curve follows a diagonal line from the bottom left to the top right, it means the model is performing no better than random guessing. The area under this curve would be 0.5, indicating poor performance.
Area Under the ROC Curve (AUC)
The AUC (Area Under the Curve) is a single number that summarizes the overall performance of a model across all classification thresholds. It represents the total area under the ROC curve. Here’s how it works:
1. AUC as a Performance Metric
The AUC value ranges from 0 to 1:
- An AUC of 1 means the model is a perfect classifier, capable of distinguishing between positive and negative classes at every threshold.
- An AUC of 0.5 means the model has no discrimination ability and is performing no better than random guessing.
2. Interpreting AUC
- Higher AUC values indicate better model performance, meaning the model is good at separating positive and negative cases.
- Lower AUC values (closer to 0.5) suggest that the model struggles to make correct classifications.
3. Why Use AUC?
AUC provides a single, easy-to-understand metric that summarizes the ROC curve and allows for the comparison of different models. It is especially useful when comparing models across different thresholds, as it offers a more holistic view than metrics like accuracy.
In short, the higher the AUC, the better the model’s ability to classify between the positive and negative classes.
Using ROC Curve and AUC for Model Selection and Threshold
The ROC curve and AUC are powerful tools for comparing models and selecting the right threshold. Here’s how they help in these tasks:
- Comparing Different Models
When evaluating multiple models, you can plot their ROC curves on the same graph. The model with the ROC curve closer to the upper-left corner is the better performer, as it has a higher true positive rate with fewer false positives. Additionally, comparing the AUC values of the models gives you a quick summary of which model performs better overall. - Choosing the Right Threshold
ROC curves can also help in choosing the right classification threshold based on the specific needs of the problem:- If you need fewer false positives, you can set a higher threshold, sacrificing some true positives but reducing the number of false positives.
- If you want to ensure that as many true positives as possible are caught, you can lower the threshold, though this might increase the number of false positives.
- The trade-off between the True Positive Rate (TPR) and False Positive Rate (FPR) at different thresholds can be visualized with the ROC curve, making it easier to choose a threshold based on your specific application.
What is the ROC Curve Used For?
The ROC curve has several important applications in machine learning and other fields. It’s a versatile tool for evaluating and comparing classification models. Here are the main uses:
1. Evaluating Classifier Performance
The ROC curve is primarily used to evaluate how well a classification model can separate positive and negative cases. By looking at the curve, you can assess the trade-off between the True Positive Rate (TPR) and False Positive Rate (FPR) at different thresholds.
2. Choosing a Classification Threshold
The ROC curve helps you select the best threshold for your model based on the desired trade-off between catching true positives and avoiding false positives. This is especially useful in scenarios where the cost of false positives and false negatives differs, such as in medical diagnoses or fraud detection.
3. Model Selection
When comparing multiple models, the ROC curve offers a clear way to see which model performs better across different thresholds. A higher AUC indicates that a model performs better overall at distinguishing between classes. This helps in selecting the best model for the task at hand.
Who Uses ROC Curves?
ROC curves are used across various industries and fields where classification tasks are crucial. Here are some of the key areas where ROC curves are commonly applied:
1. Machine Learning and Data Science
In machine learning, ROC curves are widely used to evaluate and compare models for tasks like spam detection, customer churn prediction, and sentiment analysis. Data scientists use the ROC curve to understand how well their models perform and to optimize model thresholds.
2. Medical Diagnosis
ROC curves are crucial in the medical field, especially for diagnostic tests. For instance, in detecting diseases like cancer or diabetes, doctors use ROC curves to balance sensitivity (catching true positives) and specificity (avoiding false positives), ensuring that tests are both accurate and reliable.
3. Fraud Detection
Financial institutions use ROC curves to evaluate models that detect fraudulent transactions. By adjusting the threshold for classifying fraud, banks and businesses can minimize false alarms while catching real fraud cases.
4. Risk Management
In risk management, companies use ROC curves to evaluate models that predict risky behaviors or events, such as credit defaults or market risks. The ROC curve helps find the right balance between identifying high-risk cases and minimizing false predictions.
Using ROC-AUC for a Multi-Class Model
While ROC curves are traditionally used for binary classification (i.e., classifying between two classes like spam vs. not spam), they can also be adapted for multi-class classification tasks. Here’s how ROC and AUC work in such cases:
1. One-vs-Rest (OvR) Strategy
In multi-class classification, the One-vs-Rest (OvR) strategy is commonly used. In this approach, each class is treated as a separate binary classification problem. For example, in a task with three classes (A, B, and C), the model would create three ROC curves:
- One ROC curve for class A vs. the rest (B and C),
- One for class B vs. the rest (A and C),
- One for class C vs. the rest (A and B).
The AUC values are then calculated for each class, and the overall performance is typically evaluated as the average AUC across all classes.
2. Interpreting AUC for Multi-Class
The interpretation of AUC for multi-class models remains the same—higher AUC values indicate better model performance in distinguishing between the classes. However, since multi-class tasks are more complex, the individual AUC values for each class can vary, providing deeper insights into how well the model performs on each class.
3. Limitations
One limitation of using ROC-AUC in multi-class classification is that it may become less intuitive to interpret compared to binary classification. Additionally, in highly imbalanced datasets, the performance for some classes might be harder to gauge accurately using ROC curves alone.
Pros and Cons of ROC-AUC
Like any evaluation metric, the ROC curve and AUC have their strengths and limitations. Let’s look at the pros and cons of using ROC-AUC in model evaluation.
Pros:
- Model-Agnostic
The ROC curve and AUC can be used to evaluate the performance of any classification model, regardless of the underlying algorithm. This makes it a flexible and widely applicable tool across different types of models. - Threshold-Independent
One of the biggest advantages of ROC-AUC is that it evaluates model performance across all classification thresholds. This provides a holistic view of how well the model distinguishes between classes, without focusing on a single threshold. - Focus on True Positives and Negatives
The ROC curve emphasizes the relationship between true positives (correctly identified cases) and false positives (incorrectly identified cases). This is useful when both classes (positive and negative) are important to classify correctly.
Cons:
- Less Informative for Imbalanced Datasets
In cases where the dataset is highly imbalanced (e.g., where one class significantly outnumbers the other), the ROC curve can sometimes give an overly optimistic view of the model’s performance. This is because it doesn’t fully reflect how well the model handles the minority class. - Doesn’t Account for Error Costs
ROC-AUC does not consider the costs associated with different types of errors (false positives and false negatives). In some applications, like fraud detection or medical diagnosis, false positives and false negatives may have very different costs, and other metrics might be more useful.
Conclusion
The ROC curve is an essential tool for evaluating classification models in machine learning. It provides a clear visual representation of the trade-offs between true positives and false positives across different classification thresholds. The AUC (Area Under the Curve) offers a single metric that summarizes the model’s overall performance, making it easier to compare models and choose the best one.
While ROC-AUC is useful for many scenarios, especially in binary classification, it’s important to keep in mind its limitations, such as being less effective in imbalanced datasets or when the costs of errors vary. Despite these challenges, ROC-AUC remains a valuable metric for gaining insights into a model’s ability to distinguish between classes, whether in machine learning, medical diagnostics, or fraud detection.
For beginners, understanding the ROC curve is a key step in learning how to evaluate classification models, allowing you to make better decisions about model performance and threshold selection.


