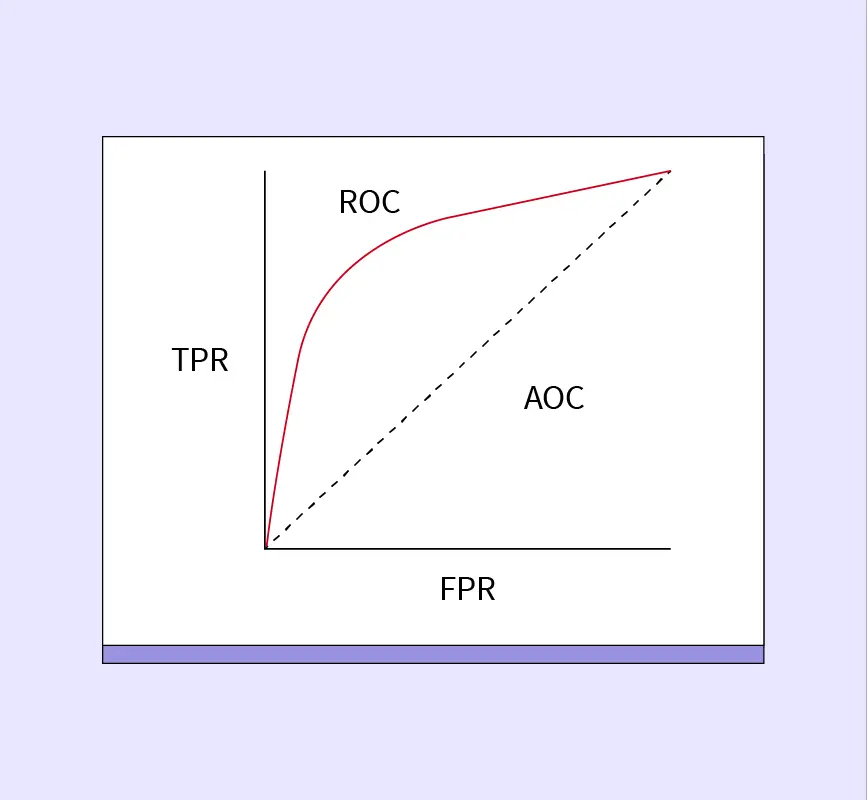
Machine learning offers numerous algorithms for making predictions and solving classification problems. One of the most widely used algorithms for classification tasks is logistic regression. Despite its name, logistic regression is not used for regression analysis; instead, it is applied to predict the probability of an event occurring, particularly in binary and multiclass classification tasks. Its simplicity, interpretability, and effectiveness make it a popular choice for tasks like spam detection and medical diagnoses, where predicting outcomes with clear probabilities is essential.
What is Logistic Regression?
Logistic regression is a supervised learning algorithm used to estimate the probability that a given instance belongs to a particular class. It works by modeling the relationship between a categorical dependent variable and one or more independent variables. Logistic regression is particularly useful for binary outcomes, such as classifying whether an email is spam or not.
Unlike linear regression, which predicts continuous numerical values, logistic regression outputs probabilities between 0 and 1. It achieves this by passing the linear combination of input features through a sigmoid function, ensuring that predictions remain within a valid probability range.
Real-life Applications of Logistic Regression in Machine Learning
- Spam Detection: Logistic regression classifies emails as spam or non-spam based on features like subject line and sender.
- Medical Diagnosis: It predicts the presence or absence of a disease based on patient data.
- Churn Prediction: Logistic regression helps businesses identify customers likely to cancel their subscriptions.
- Loan Default Prediction: Determines whether a loan applicant is likely to default.
Logistic Function – Sigmoid Function
The sigmoid function is at the heart of logistic regression. It takes the linear output of a model and transforms it into a probability value between 0 and 1.
Mathematical Formulation
The sigmoid function is defined as:
$$\sigma(z) = \frac{1}{1 + e^{-z}}$$
where zzz is the linear combination of the input features. This function maps any input value to a range between 0 and 1, which can then be interpreted as the probability of the target variable belonging to a specific class.
Graphical Representation of the Sigmoid Curve
The sigmoid curve has an S-shape. At the center (where z=0z = 0z=0), the output is 0.5, indicating equal probabilities for both classes. As zzz increases, the probability approaches 1, and as zzz decreases, the probability approaches 0.
Importance of the Sigmoid Function
The sigmoid function ensures that logistic regression produces outputs interpretable as probabilities. These probabilities are then used to classify instances into different classes based on a predefined threshold (e.g., 0.5).
Types of Logistic Regression in Machine Learning
Logistic regression comes in several forms, depending on the nature of the target variable:
- Binomial Logistic Regression: Applied when the dependent variable has two outcomes (e.g., spam vs. non-spam).
- Multinomial Logistic Regression: Used when the target variable has more than two categories without a natural order (e.g., product categories).
- Ordinal Logistic Regression: Applied when the dependent variable has ordered categories (e.g., satisfaction levels: low, medium, high).
Assumptions of Logistic Regression
For logistic regression to work effectively, certain assumptions need to be met:
- Binary Outcome: For binomial logistic regression, the target variable must have two categories.
- No Multicollinearity: The independent variables should not be highly correlated with each other.
- Linear Relationship: A linear relationship must exist between the independent variables and the log-odds of the dependent variable.
- Large Sample Size: Logistic regression performs better with larger datasets to ensure stable estimates.
Violating these assumptions can lead to inaccurate predictions and biased estimates.
Terminologies Involved in Logistic Regression
Several key terms are associated with logistic regression:
- Dependent Variable: The target variable to be predicted.
- Odds Ratio: Represents the odds of an event occurring versus not occurring.
- Logit Function: The natural logarithm of the odds.
- Maximum Likelihood Estimation (MLE): A method used to estimate the coefficients.
- Coefficient Interpretation: Explains how changes in the independent variables affect the odds of the outcome.
How Does Logistic Regression Work?
1. Sigmoid Function and Probability Estimation
The sigmoid function transforms the linear regression output into a probability value between 0 and 1.
2. Logistic Regression Equation
The logistic regression equation is:
$$\log \left( \frac{p}{1 – p} \right) = \beta_0 + \beta_1 X_1 + \ldots + \beta_n X_n$$
where ppp is the predicted probability, $\beta_0$ is the intercept, and $\beta_1, \ldots, \beta_n$ are the coefficients.
3. Maximum Likelihood Estimation (MLE)
MLE is used to estimate the parameters by maximizing the likelihood of the observed data.
4. Optimization with Gradient Descent
Gradient descent is employed to find the optimal coefficients by minimizing the error between predicted and actual values.
Python Code Implementation for Logistic Regression
Below is a Python code example using scikit-learn:
from sklearn.linear_model import LogisticRegression

from sklearn.model_selection import train_test_split

from sklearn.metrics import accuracy_score, confusion_matrix

# Sample dataset

X = [[1, 2], [2, 3], [3, 4], [4, 5]]

y = [0, 0, 1, 1]

# Train-test split

X_train, X_test, y_train, y_test = train_test_split(X, y, test_size=0.2, random_state=42)

# Model training

model = LogisticRegression()

model.fit(X_train, y_train)

# Predictions

y_pred = model.predict(X_test)

# Evaluation

print("Accuracy:", accuracy_score(y_test, y_pred))

print("Confusion Matrix:\n", confusion_matrix(y_test, y_pred))
How to Evaluate a Logistic Regression Model?
Key metrics for evaluating the performance of a logistic regression model include:
- Accuracy: Proportion of correctly predicted instances.
- Precision: True positives divided by all predicted positives.
- Recall: True positives divided by all actual positives.
- F1-Score: Harmonic mean of precision and recall.
- Confusion Matrix: A table showing true vs. predicted values.
Precision-Recall Tradeoff in Logistic Regression
The threshold setting in logistic regression affects the tradeoff between precision and recall. Lowering the threshold increases recall but decreases precision, while raising it improves precision but lowers recall.
Differences between Linear and Logistic Regression
| Aspect | Linear Regression | Logistic Regression |
| Objective | Predicts continuous numerical values | Predicts probabilities for classification |
| Output Type | Real-valued outputs (can be negative or positive) | Probability values between 0 and 1 |
| Use Case | Suitable for regression tasks (e.g., stock price prediction) | Suitable for classification tasks (e.g., spam detection) |
| Algorithm Type | Regression | Classification |
| Equation Used | $Y = \beta_0 + \beta_1 X + \ldots + \beta_n X_n$ | $\log \left( \frac{p}{1 – p} \right) = \beta_0 + \beta_1 X$ |
| Nature of Relationship | Models linear relationships between dependent and independent variables | Handles non-linear relationships through log transformation |
| Handling of Categorical Data | Not suitable for categorical target variables | Handles binary and multiclass categorical outcomes effectively |
| Error Metric | Uses Mean Squared Error (MSE) for evaluation | Uses Log Loss or Cross-Entropy Loss |
| Output Interpretation | Direct numerical prediction | Probability that the instance belongs to a specific class |
| Applicability | Predicts quantities (e.g., sales figures) | Predicts class labels or probabilities (e.g., customer churn) |
Conclusion
Logistic regression is a fundamental algorithm in machine learning, known for its simplicity and effectiveness in solving classification problems. Its ability to predict probabilities makes it invaluable in fields like healthcare, finance, and marketing. Exploring related algorithms like SVM and decision trees can further enhance your understanding of classification tasks.
References:


