In 2008, the financial industry was shaken by a global crisis. Amid the chaos, a small team of data analysts uncovered hidden patterns in loan defaults using Exploratory Data Analysis (EDA), revealing the cracks in the mortgage system that triggered the downfall. This real-world example highlights the immense power of EDA, a critical step in the data science process designed to uncover insights that might otherwise remain hidden.
Exploratory Data Analysis (EDA) is the process of analyzing datasets to summarize their main characteristics, often with visual methods. This ‘exploration’ phase allows data scientists to dive into data and make sense of it before jumping into formal modeling, ensuring that critical patterns, outliers, and relationships are not overlooked. Given its significance in driving data-driven decisions, EDA has become an indispensable part of the data science lifecycle.
What is Exploratory Data Analysis (EDA)?
Exploratory Data Analysis (EDA) is a crucial phase in data science where the primary goal is to understand the data at hand, detect patterns, and gain insights without making any assumptions. Unlike other analytical methods, EDA is highly iterative and flexible, allowing data scientists to explore data from multiple perspectives. Through visualization techniques, summary statistics, and statistical methods, EDA provides a foundational understanding that guides further analysis and modeling.
Objectives of Exploratory Data Analysis:
- Understanding Data Characteristics: The first objective of EDA is to explore the basic structure of the dataset—its distribution, central tendency, variability, and shape. This helps in identifying normality, skewness, or patterns.
- Identifying Patterns: EDA uncovers potential relationships between variables. For example, a scatter plot may reveal a positive correlation between two variables that can be further investigated.
- Detecting Anomalies: Outliers and anomalies can distort results and mislead conclusions. EDA helps in spotting these anomalies early on.
- Formulating Hypotheses: By generating visualizations and statistical summaries, EDA aids in hypothesis generation, preparing the data for confirmatory data analysis (CDA).
EDA vs. Confirmatory Data Analysis (CDA):
While EDA is about exploration and discovering unknown insights, CDA (Confirmatory Data Analysis) focuses on testing predefined hypotheses. EDA is flexible and does not follow strict rules, while CDA is structured and typically follows specific statistical protocols to test a hypothesis.
Why EDA Important in Data Science
Exploratory Data Analysis (EDA) is a fundamental part of the data science process. It lays the groundwork for every subsequent step, from data cleaning to model building, ensuring that decisions are based on a deep understanding of the data. Without EDA, critical insights may be missed, leading to poor model performance or inaccurate conclusions.
1. Foundation for Informed Decisions
EDA empowers data scientists to make informed decisions throughout the analysis. By getting a clear picture of the data, they can identify the most appropriate data cleaning techniques, feature engineering strategies, and modeling methods. For example, understanding the distribution of data informs whether transformations (like log scaling) are necessary.
2. Unveiling Hidden Insights
EDA can uncover unexpected trends and patterns that may not be immediately visible. For instance, in a marketing dataset, EDA might reveal that certain customer segments are more responsive to specific promotions. Such insights are valuable for fine-tuning marketing strategies or even developing new hypotheses for testing.
3. Data Quality Assurance
One of the key benefits of EDA is its ability to highlight data quality issues early on. Detecting missing values, outliers, and inconsistencies allows data scientists to address these problems before they impact further analysis. By identifying and resolving such issues, EDA improves the overall quality of the dataset, resulting in more reliable models.
Here are some of the key reasons why EDA is a critical step in the data science workflow:
- Understanding Data Structures: EDA helps in breaking down complex datasets into understandable chunks, making it easier to see the bigger picture.
- Identifying Patterns and Relationships: Whether it’s correlations between variables or trends over time, EDA reveals key relationships that can guide further analysis.
- Detecting Anomalies and Outliers: Outliers can skew results and distort models. EDA helps pinpoint these anomalies, ensuring they are treated appropriately.
- Testing Assumptions: Before building models, it’s essential to test assumptions about the data. EDA allows data scientists to check these assumptions, such as normality or linearity, before proceeding.
- Informing Feature Selection and Engineering: EDA can suggest new features or transformations that may improve model performance.
- Optimizing Model Design: Insights gained from EDA inform the design of machine learning models, helping data scientists decide which algorithms to use.
- Facilitating Data Cleaning: By identifying inconsistencies or inaccuracies, EDA streamlines the data cleaning process.
- Enhancing Communication: Visualizations created during EDA help communicate findings clearly, ensuring stakeholders understand key insights.
Types of Exploratory Data Analysis
Exploratory Data Analysis (EDA) can be broken down into several categories, each focused on different aspects of data. These techniques allow data scientists to explore relationships, patterns, and anomalies at various levels of complexity, from individual variables to interactions between multiple variables.
1. Univariate Analysis
Univariate analysis focuses on understanding a single variable at a time. This type of analysis helps identify the distribution, central tendency (mean, median), and variability (range, variance) of the data. Some common techniques include:
- Summary Statistics: Calculating mean, median, mode, standard deviation, etc.
- Histograms: Visualizing the distribution of a variable to assess its shape (e.g., normal, skewed).
- Box Plots: Highlighting the spread of the data and identifying outliers.
- Density Plots: Showing the probability distribution of a continuous variable.
2. Bivariate Analysis
Bivariate analysis examines the relationship between two variables. It helps reveal correlations and dependencies that may not be immediately obvious. Some key methods include:
- Scatter Plots: Useful for visualizing the relationship between two continuous variables. Patterns such as linear, exponential, or no correlation can be observed.
- Correlation Matrices: Displaying the correlation coefficients between multiple variables, providing a quick snapshot of potential linear relationships.
- Contingency Tables: Used for categorical variables, these tables show the frequency distribution of variables and help determine if they are related.
3. Multivariate Analysis
Multivariate analysis explores interactions between three or more variables, allowing for a deeper understanding of complex relationships. Techniques include:
- Principal Component Analysis (PCA): Reduces the dimensionality of data, making it easier to visualize and interpret while preserving the most important information.
- Cluster Analysis: Groups similar data points into clusters based on their features, often used in market segmentation and customer analysis.
- Dimensionality Reduction: Besides PCA, other methods like t-SNE and LDA are used to reduce high-dimensional data into a form that is easier to visualize and understand.
4. Specialized EDA Techniques
For specific types of data, specialized EDA techniques can be applied:
- Time Series Analysis: Techniques like line plots and autocorrelation are used to understand trends and seasonality in time-based data.
- Spatial Data Analysis: Used for geospatial datasets to visualize patterns over geographic areas.
- Text Mining: EDA techniques can also be applied to textual data to uncover patterns in word frequency, sentiment, and topic distribution.
Essential Tools for EDA
The success of Exploratory Data Analysis (EDA) largely depends on the tools used to explore and visualize the data. Whether you’re working with small datasets or large-scale data, a variety of tools are available to help you carry out EDA effectively. These tools range from programming libraries to specialized software that offers intuitive visual exploration capabilities.
1. Python Libraries
Python is a widely-used language for data science, and several powerful libraries support EDA:
- pandas: This library is indispensable for data manipulation and analysis. With pandas, you can handle missing data, filter datasets, and compute summary statistics.
- NumPy: Essential for numerical computations, NumPy allows for efficient handling of arrays and matrices, often used in tandem with pandas.
- Matplotlib: A foundational plotting library, Matplotlib is used for creating basic visualizations like histograms, scatter plots, and line charts.
- Seaborn: Built on top of Matplotlib, Seaborn provides a more intuitive interface for creating aesthetically pleasing and informative visualizations like heatmaps, violin plots, and pair plots.
2. R Packages
R is another popular language for data analysis, with a rich ecosystem of packages for EDA:
- dplyr: Known for its intuitive grammar of data manipulation, dplyr makes it easy to filter, summarize, and arrange data.
- ggplot2: This package is the go-to tool for creating complex, layered visualizations. Its versatility allows you to create anything from bar plots to advanced statistical graphics.
- tidyr: As part of the “tidyverse,” tidyr simplifies reshaping and tidying data, ensuring it is in the right format for analysis.
3. Other Tools
While Python and R are common, there are other specialized tools for EDA:
- Excel: For small datasets, Excel provides an easy-to-use interface with built-in functions for quick exploratory analysis.
- Tableau: Known for its advanced data visualization capabilities, Tableau allows users to create interactive dashboards and visualizations, perfect for exploring large datasets dynamically.
- Power BI: Similar to Tableau, Power BI offers dynamic reporting and visualization tools with a focus on ease of use.
- Plotly: An interactive graphing library that can be used in both Python and JavaScript to create web-based interactive plots for detailed EDA.
Code Snippets
To get started with EDA in Python, here are a few basic code snippets demonstrating common tasks:
1. Loading Data:
import pandas as pd
data = pd.read_csv('data.csv')
2. Summary Statistics:
data.describe()3. Visualization (Histograms):
import seaborn as sns
sns.histplot(data['column_name'])
4. Correlation Matrix:
import matplotlib.pyplot as plt
import seaborn as sns
corr = data.corr()
sns.heatmap(corr, annot=True, cmap='coolwarm')
plt.show()
These libraries and tools form the backbone of EDA, providing both the flexibility and power needed to explore datasets comprehensively.
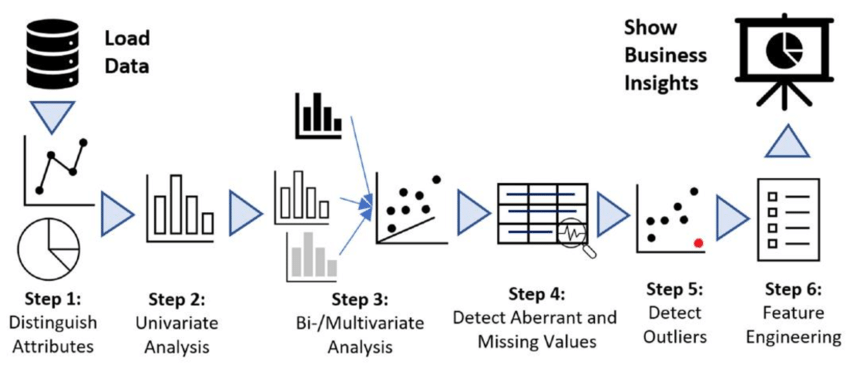
Step-by-Step Guide to Performing EDA
Exploratory Data Analysis (EDA) is a structured yet flexible process that helps data scientists gain an in-depth understanding of their datasets before formal modeling. Below is a step-by-step guide to performing EDA, from defining objectives to creating visualizations.
1. Define the Problem and Goals
Before diving into the data, it’s crucial to define the problem you’re trying to solve. Whether it’s predicting customer churn or optimizing marketing campaigns, having a clear objective helps guide the analysis process. At this stage, you should also identify the key variables and metrics you’ll focus on during EDA.
2. Data Collection and Loading
Once you’ve defined the problem, the next step is to gather relevant data. Data can come from various sources like databases, APIs, or CSV files. After collection, load the data into your analysis environment. For Python users, pandas is the most common tool for data loading:
import pandas as pd
data = pd.read_csv('data.csv')
3. Data Cleaning and Preprocessing
Raw data is rarely perfect and often contains missing values, duplicates, or inconsistencies. Data cleaning is essential to ensure that your analysis is accurate and reliable. Key tasks include:
- Handling missing values: Decide whether to drop or impute missing data using techniques like mean imputation or filling with a default value.
- Removing duplicates: Ensure there are no repeated rows or entries.
- Correcting data types: Make sure numerical columns are treated as numbers, dates as dates, etc.
# Handling missing values example:
data['column_name'].fillna(data['column_name'].mean(), inplace=True)
4. Exploratory Analysis
With clean data, you can now begin the exploratory phase. This step is iterative, where you’ll apply a range of univariate, bivariate, and multivariate techniques to uncover hidden patterns, anomalies, and relationships. Use visualizations to make sense of the data.
- Univariate Analysis: Focus on individual variables using histograms, box plots, and summary statistics.
- Bivariate Analysis: Explore relationships between two variables using scatter plots and correlation matrices.
- Multivariate Analysis: Look at relationships among multiple variables using techniques like Principal Component Analysis (PCA).
# Handling missing values example:
data['column_name'].fillna(data['column_name'].mean(), inplace=True)
5. Feature Engineering
Feature engineering involves creating new variables from existing ones to improve model performance. EDA can help identify potential new features, such as creating a ratio between two variables or generating interaction terms that capture relationships between predictors.
6. Communication and Visualization
The insights gained from EDA need to be effectively communicated to both technical and non-technical stakeholders. Visualizations play a key role in making data understandable. Tools like Matplotlib, Seaborn, and Tableau can be used to create clear and informative charts. Always ensure your visuals are easy to interpret and tell a story about the data.
# Example of a heatmap for visualizing correlations:
import matplotlib.pyplot as plt
sns.heatmap(data.corr(), annot=True, cmap='coolwarm')
plt.show()
Going Beyond the Basics: Advanced EDA Techniques
While traditional EDA techniques provide a solid foundation for understanding data, advanced methods allow data scientists to extract deeper insights and handle more complex datasets. These techniques are particularly useful when dealing with large, multidimensional datasets or when specific issues like anomalies need to be addressed.
1. Anomaly Detection
Detecting unusual data points or patterns is critical in many applications, from fraud detection to sensor monitoring. Advanced anomaly detection techniques, such as Isolation Forests and DBSCAN (Density-Based Spatial Clustering of Applications with Noise), can help pinpoint outliers that might not be evident in basic EDA.
- Isolation Forest: This machine learning algorithm isolates anomalies by randomly partitioning the dataset, treating data points that are easier to isolate as anomalies.
- DBSCAN: A clustering method that groups data points based on density, separating outliers that don’t fit into any cluster.
# Example of using Isolation Forest in Python:
from sklearn.ensemble import IsolationForest
clf = IsolationForest(random_state=42)
outliers = clf.fit_predict(data)
2. Interactive Data Exploration
Traditional static visualizations have their limits. Interactive data exploration tools allow users to engage with data in real-time, adjusting parameters and filtering information on the fly. Platforms like Tableau, Plotly, and Power BI provide dynamic dashboards where users can explore trends, drill down into specific variables, and customize views. These tools are especially valuable in business environments, where stakeholders can explore the data without needing a data scientist at every step.
3. Machine Learning in EDA
Unsupervised machine learning techniques are increasingly being integrated into EDA to uncover hidden patterns in data. These methods allow for pattern discovery without predefined labels or outcomes.
- Clustering Algorithms (e.g., K-means, Hierarchical Clustering): These group similar data points together, revealing natural groupings in the data.
- Dimensionality Reduction Techniques (e.g., PCA, t-SNE): These reduce the complexity of datasets, making it easier to visualize and interpret high-dimensional data. For instance, PCA can transform dozens of features into a few principal components that capture the most variance.
Future Trends of Exploratory Data Analysis
EDA is constantly evolving, with new techniques and tools emerging. Automated EDA platforms, powered by AI, are becoming increasingly popular. These tools automatically generate summaries, visualizations, and insights from data, reducing the manual effort required for EDA. In the future, we may see even greater integration of AI, making EDA faster and more powerful.
Conclusion
Exploratory Data Analysis (EDA) plays a pivotal role in the data science process, enabling data scientists to gain critical insights into their datasets before diving into more formal modeling techniques. By identifying patterns, spotting anomalies, and ensuring data quality, EDA lays the foundation for building robust models and making informed decisions.
Whether you’re using basic techniques like univariate analysis or advanced methods like machine learning-based anomaly detection, EDA provides the tools needed to turn raw data into actionable insights. The flexibility and iterative nature of EDA make it indispensable for uncovering hidden relationships and guiding further exploration.