Evaluation metrics are essential in machine learning to measure how well a model performs on a given dataset. They provide a standardized way to assess the effectiveness of models, helping data scientists decide whether a model is ready for deployment or needs further improvement. Without appropriate evaluation metrics, selecting the best model for a specific task would be challenging. For instance, metrics like accuracy, precision, or mean squared error allow us to quantify performance, enabling better decision-making.
Evaluation metrics can vary depending on the type of problem: classification or regression. This guide explains the key evaluation metrics for both types and how to choose the right ones for your machine learning projects.
Classification Metrics
Classification metrics evaluate models that predict discrete outcomes, such as determining whether an email is spam or not. These metrics help assess how well the model distinguishes between different classes. Below are some commonly used metrics for classification tasks:
1. Classification Accuracy
Accuracy is one of the simplest metrics. It measures the percentage of correctly predicted labels out of the total predictions.
Formula:
$$\text{Accuracy} = \frac{\text{Number of Correct Predictions}}{\text{Total Predictions}}$$
Example: If a model correctly classifies 90 out of 100 test samples, the accuracy is 90%.
Limitations: Accuracy can be misleading when working with imbalanced datasets. For example, in a dataset where 95% of the samples belong to one class, a model predicting only the majority class will have high accuracy but poor overall performance.
Solution: Use additional metrics like Precision, Recall, or the F1 Score for imbalanced datasets.
2. Precision
Precision indicates the proportion of correctly predicted positive results out of all predicted positive results. It’s crucial when minimizing false positives is more important than capturing all positives, such as in spam detection or financial fraud analysis.
Formula:
$$\text{Precision} = \frac{\text{True Positives (TP)}}{\text{True Positives (TP)} + \text{False Positives (FP)}}$$
Example: If a spam filter correctly identifies 80 spam emails but incorrectly flags 20 non-spam emails as spam, the precision is $\frac{80}{80+20} = 80\%$
Use Case: In medical testing, precision is vital when confirming a diagnosis (e.g., detecting cancer) to avoid unnecessary treatments due to false positives.
3. Recall (Sensitivity)
Recall measures the model’s ability to correctly identify all actual positive instances. It is especially important in scenarios where missing true positives has severe consequences, such as detecting diseases or security breaches.
Formula:
$$\text{Recall} = \frac{\text{True Positives (TP)}}{\text{True Positives (TP)} + \text{False Negatives (FN)}}$$
Example: If a model detects 90 out of 100 actual spam emails, its recall is $\frac{90}{90+10} = 90\%$
Use Case: In fraud detection, a high recall ensures that as many fraudulent cases as possible are flagged, even if it means some false positives.
4. F1 Score
The F1 score is the harmonic mean of precision and recall, providing a balance between the two. It is useful when precision and recall are equally important.
Formula:
$$\text{F1 Score} = 2 \times \frac{\text{Precision} \cdot \text{Recall}}{\text{Precision} + \text{Recall}}$$
Example: For a model with precision of 80% and recall of 70%, the F1 score is $\frac{2 \times 0.8 + 0.7}{0.8 \times 0.7} = 74.3\%$
Use Case: It is effective in imbalanced datasets where Precision and Recall might not individually reflect the model’s true performance.
5. Logarithmic Loss (Log Loss)
Log Loss evaluates the uncertainty of a model’s predictions by considering the probability of predicted classes. Models that assign high probabilities to incorrect predictions are penalized more.
Formula:
$$\text{Log Loss} = -\frac{1}{N} \sum_{i=1}^N \left[ y_i \log(p_i) + (1 – y_i) \log(1 – p_i) \right]$$
Example: If a model predicts a probability of 0.9 for a correct class, the penalty is minimal. However, predicting 0.1 for the correct class results in a higher penalty.
Use Case: Log Loss is frequently used in multi-class classification problems to capture the model’s confidence.
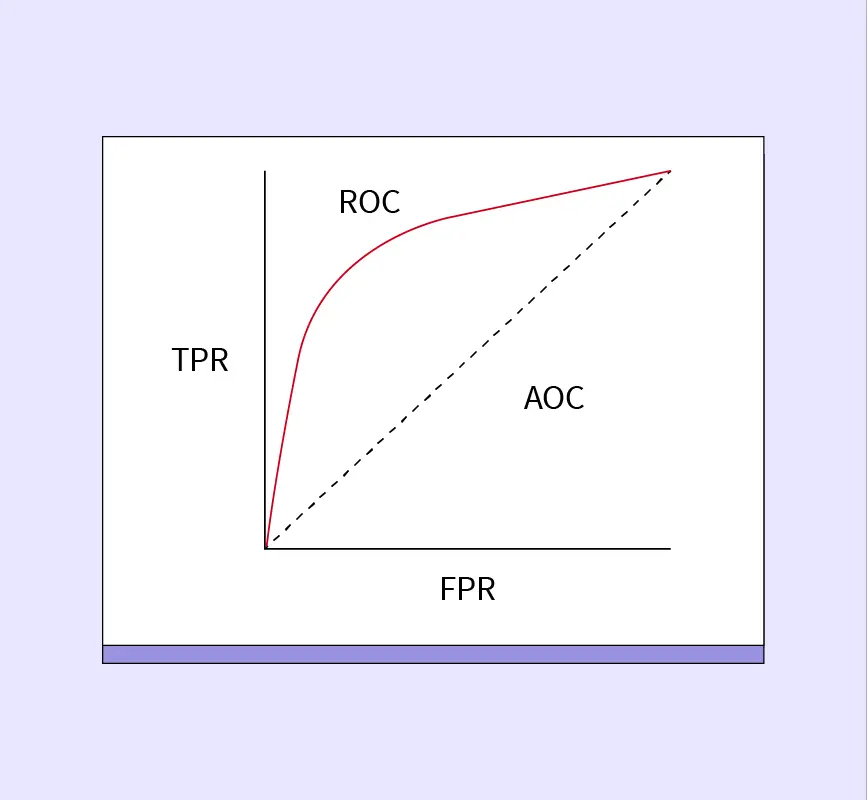
6. Area Under the Curve (AUC) – Receiver Operating Characteristic (ROC)
AUC-ROC measures the model’s ability to distinguish between positive and negative classes across various threshold levels. It plots the True Positive Rate (Recall) against the False Positive Rate (1 – Specificity).
Key Components:
- True Positive Rate (Recall): $\frac{\text{TP}}{\text{TP} + \text{FN}}$
- False Positive Rate: $\frac{FP + TN}{FP}$
Interpretation:
- AUC = 1: Perfect classification.
- AUC = 0.5: No discrimination (random guessing).
Use Case: AUC-ROC is commonly used in binary classification tasks like email classification or credit default prediction.
7. Specificity
Specificity measures the proportion of correctly identified negatives out of all actual negatives. It complements Recall in scenarios where minimizing false positives is also critical.
Formula:
$$\text{Specificity} = \frac{\text{True Negatives (TN)}}{\text{True Negatives (TN)} + \text{False Positives (FP)}}$$
Use Case: In medical screening, high specificity ensures that healthy individuals are not incorrectly diagnosed with a disease.
8. Confusion Matrix
A confusion matrix provides a comprehensive overview of a model’s predictions, breaking them down into:
- True Positives (TP): Correctly predicted positives.
- True Negatives (TN): Correctly predicted negatives.
- False Positives (FP): Incorrectly predicted positives.
- False Negatives (FN): Missed positives.
Example of Confusion Matrix:
| Predicted Positive | Predicted Negative | |
| Actual Positive | True Positive (TP) | False Negative (FN) |
| Actual Negative | False Positive (FP) | True Negative (TN) |
Use Case: The confusion matrix is a versatile tool for calculating other metrics like Precision, Recall, and Specificity.
9. Balanced Accuracy
Balanced Accuracy accounts for imbalanced datasets by averaging the Recall of each class.
Formula:
$$\text{Balanced Accuracy} = \frac{\text{Sensitivity} + \text{Specificity}}{2}$$
Use Case: Useful when classes are highly imbalanced, such as fraud detection or rare disease diagnosis.
Regression Evaluation Metrics
Regression metrics are used to evaluate machine learning models that predict continuous outcomes, such as housing prices, stock values, or sales forecasts. These metrics measure the difference between the predicted and actual values to determine how well a model performs in regression tasks. Below is a detailed explanation of the most commonly used regression metrics.
1. Mean Absolute Error (MAE)
MAE measures the average magnitude of errors in a set of predictions, without considering their direction. It represents the average absolute difference between predicted values and actual values.
Formula:
$$\text{MAE} = \frac{1}{N} \sum_{i=1}^{N} \left| y_i – \hat{y}_i \right|$$
- $y_i$: Actual value.
- $\hat{y}_i$: Predicted value.
- $N$: Number of data points.
Example: If the actual values are [3, 5, 7] and the predicted values are [2, 5, 8], the MAE is:
$$\frac{(3 – 2)^2 + (5 – 5)^2 + (7 – 8)^2}{3} = \frac{1 + 0 + 1}{3} = 0.67$$
2. Mean Squared Error (MSE)
MSE calculates the average squared difference between the actual and predicted values. Unlike MAE, it gives higher weight to larger errors, making it sensitive to outliers.
Formula:
$$\text{MSE} = \frac{1}{N} \sum_{i=1}^{N} (y_i – \hat{y}_i)^2$$
Example: Using the same values as above, the MSE is:
$$\frac{(3-2)^2 + (5-5)^2 + (7-8)^2}{3} = \frac{1+0+1}{3} = 0.67$$
Use Case: MSE is suitable for tasks where large errors are highly undesirable, such as financial predictions.
3. Root Mean Squared Error (RMSE)
RMSE is the square root of MSE and provides error estimates in the same unit as the target variable. It is widely used for its interpretability and sensitivity to large errors.
Formula:
$$\text{RMSE} = \sqrt{\frac{1}{N} \sum_{i=1}^{N} (y_i – \hat{y}_i)^2}$$
Example: Using the same values as above, the RMSE is:
$$\sqrt{0.67} \approx 0.82$$
Use Case: RMSE is preferred in applications where the magnitude of the error is critical, such as predicting demand for utilities.
4. Root Mean Squared Logarithmic Error (RMSLE)
RMSLE calculates the square root of the logarithmic differences between predicted and actual values. It penalizes under-predictions more than over-predictions, making it suitable for targets with large ranges.
Formula:
$$RMSLE = \sqrt{\frac{1}{N} \sum_{i=1}^{N} \left( \log(1 + y_i) – \log(1 + \hat{y}_i) \right)^2}$$
Example: If $y_i = [10, 100]$ and $\hat{y}_i = [12, 110]$, RMSLE computes the error considering their relative differences.
Use Case: RMSLE is often used in scenarios like sales forecasting, where large variations in the target variable exist.
5. R² Score (Coefficient of Determination)
R² measures the proportion of variance in the dependent variable that is predictable from the independent variable(s). It ranges from 0 to 1, with higher values indicating better performance.
Formula:
$$R^2 = 1 – \frac{SS_{\text{total}}}{SS_{\text{residual}}}$$
- $SS_{\text{residual}}$ : Sum of squared residuals.
- $SS_{\text{total}}$ : Total sum of squares.
Example: An $R^2$ score of 0.85 means the model explains 85% of the variance in the target variable.
Use Case: It’s widely used in linear regression and serves as a quick measure of model performance.
6. Adjusted R² Score
The adjusted R² score modifies the R² score to account for the number of predictors in the model, preventing overfitting.
Formula:
$$\text{Adjusted } R^2 = 1 – \left( 1 – R^2 \right) \frac{N – k – 1}{N – 1}$$
- $N$: Number of observations.
- $k$: Number of predictors.
Use Case: Essential for evaluating models with multiple features or predictors.
7. Mean Bias Deviation (MBD)
MBD calculates the average bias in predictions, showing whether the model tends to over-predict or under-predict.
Formula:
$$\text{MBD} = \sum_{i=1}^N (y_i – \hat{y}_i)$$
Use Case: It’s a diagnostic metric to identify systemic bias in predictions.
Additional Considerations
Selecting the appropriate evaluation metric is a critical step in machine learning model development. The choice depends on the specific problem, the nature of the dataset, and the desired outcome. Below are guidelines for choosing the right metric based on different scenarios:
1. Classification Tasks
- Balanced Datasets: Use Accuracy when the dataset has roughly equal distribution among classes.
- Imbalanced Datasets: Metrics like Precision, Recall, or F1 Score are more suitable, as they focus on the model’s performance on minority classes.
- Precision: Best for minimizing false positives, e.g., email spam detection.
- Recall: Best for minimizing false negatives, e.g., disease diagnosis.
- F1 Score: Ideal when false positives and false negatives carry equal importance.
- Probability-Based Predictions: Use Log Loss or AUC-ROC for models providing probabilistic outputs.
2. Regression Tasks
- Uniform Error Sensitivity: Use MAE for evaluating models where all errors, regardless of size, are equally important.
- Outlier Sensitivity: Use MSE or RMSE when large errors must be penalized more, such as in financial forecasting.
- Large Range in Target Variables: Use RMSLE to evaluate performance on datasets with wide-ranging target values.
- Explained Variance: Use R² Score to understand how well the model explains the variability in the target variable.
3. Multi-Class Classification
- Use metrics like Macro-Averaged Precision and Recall or Weighted F1 Score to account for all classes when there is class imbalance.
4. Imbalanced Datasets
- Metrics such as Specificity, Recall, and Balanced Accuracy are critical in handling imbalanced datasets. For example:
- Fraud detection: Minimize false negatives using Recall.
- Medical screening: Minimize false positives using Specificity.
5. Real-World Application
- Business Objectives: Align the metric with the business goal. For instance:
- Predicting product demand: Use RMSE for accurate predictions.
- Churn prediction: Use F1 Score to balance recall and precision.
- Regulatory Requirements: In fields like healthcare or finance, regulatory compliance may dictate the choice of metric.
6. Cross-Validation
To ensure the reliability of chosen metrics, always use cross-validation. It helps validate the model across multiple subsets of the data, providing a more robust performance estimate.
Choosing the right metric not only impacts the model evaluation but also influences optimization during training. A mismatch between the metric and the problem’s goal can lead to suboptimal results.
Conclusion
Evaluation metrics are critical for assessing machine learning models and ensuring they align with the problem’s goals. For classification tasks, metrics like Precision, Recall, F1 Score, and AUC-ROC are crucial, especially for imbalanced datasets. Regression models benefit from metrics such as MAE, MSE, and R² Score to evaluate prediction accuracy.
Choosing the right metric depends on the task, dataset, and business objectives. Using cross-validation and a combination of metrics ensures a robust evaluation. By selecting metrics tailored to the problem, data scientists can develop models that perform well and deliver meaningful results in real-world applications.


