In machine learning, statistical models often rely on hidden information or latent variables—elements of data that are not directly observed but influence the overall outcomes. Identifying the optimal parameters for these models becomes challenging when such latent variables are present. The Expectation-Maximization (EM) algorithm offers a powerful solution to this problem. It is designed to find the best estimates for model parameters when some parts of the data remain hidden. This algorithm iterates through two main steps—Expectation (E-step) and Maximization (M-step)—to refine these estimates until they converge to an optimal solution.
What is an EM Algorithm?
The Expectation-Maximization (EM) algorithm is a statistical method used in machine learning to find the maximum likelihood or maximum a posteriori (MAP) estimates of model parameters when the data has hidden or incomplete elements, known as latent variables. The algorithm works iteratively through two key steps:
- Expectation Step (E-step): In this step, the algorithm calculates the expected value of the complete-data log-likelihood function using the current estimates of the parameters and the observed data. It essentially estimates the missing parts of the data based on what is currently known.
- Maximization Step (M-step): Using the estimates from the E-step, the algorithm updates the parameters by maximizing the expected log-likelihood function. This step refines the model parameters to better fit the data.

The EM algorithm repeats these steps until the parameter values stabilize, meaning they no longer change significantly. This process continues iteratively, ensuring that the estimates improve with each cycle, ultimately leading to a solution that maximizes the likelihood of the observed data.
What is Convergence In The EM Algorithm?
Convergence in the EM algorithm refers to the point when the algorithm’s iterative process stops because the parameter values no longer change significantly between iterations. Essentially, it indicates that the algorithm has found a stable solution. During each iteration, the algorithm refines the parameter estimates, and as it progresses, the changes become smaller and smaller.
However, convergence isn’t always straightforward. The EM algorithm may sometimes get stuck in local maxima, which are points where the solution seems optimal within a limited range but isn’t the best overall solution. This can happen if the initial parameter values are not chosen carefully. Hence, starting with a good initialization is crucial to ensure that the algorithm converges to the global maximum and finds the best possible solution.
How Does Expectation-Maximization (EM) Algorithm Work?
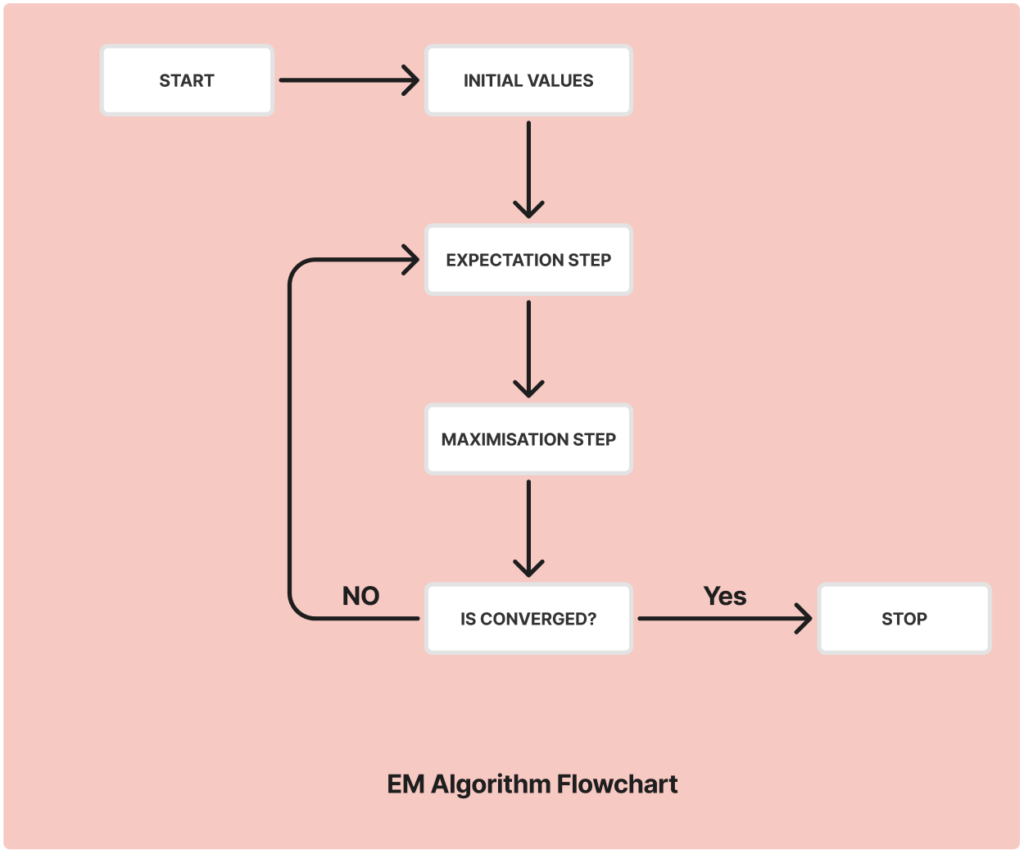
The EM algorithm works through a series of steps that are repeated until the parameters converge. Let’s break down these steps:
- Initialization: The process begins with selecting initial values for the model parameters. These initial values can be random or based on prior knowledge. The choice of these values can significantly impact the algorithm’s performance and convergence, so it’s crucial to pick them wisely.
- E-Step (Expectation Step): In this step, the algorithm calculates the expected value of the complete-data log-likelihood function based on the current parameter values and the observed data. The goal is to estimate the missing or hidden information (latent variables) using the available data.
- M-Step (Maximization Step): Using the estimates from the E-step, the algorithm then maximizes the expected log-likelihood function to update the parameter values. This step refines the model parameters to better fit the data.
- Convergence Check: The algorithm checks if the parameter values have stabilized or if the changes are below a defined threshold. If the values have not yet converged, the algorithm repeats the E-step and M-step. This iterative process continues until the parameters no longer change significantly, indicating that convergence has been reached.
This structured approach ensures that the algorithm gradually improves the parameter estimates with each iteration, leading to an optimal solution.
Implementation of EM Algorithm
To implement the EM algorithm, we’ll walk through a Python example that demonstrates how to fit a dataset using two Gaussian components. Follow these steps:
Import the Necessary Libraries
First, import the essential libraries for handling data and plotting:
import numpy as np
import matplotlib.pyplot as plt
from scipy.stats import multivariate_normal- NumPy: For handling arrays and mathematical operations.
- Matplotlib: To visualize the dataset and the results.
- SciPy: For working with multivariate normal distributions.
Generate a Dataset with Two Gaussian Components
Next, we’ll create a synthetic dataset consisting of two Gaussian distributions:
# Generate data for two Gaussian distributions
np.random.seed(0)
mean1 = [5, 5]
cov1 = [[1, 0], [0, 1]]
data1 = np.random.multivariate_normal(mean1, cov1, 150)

mean2 = [10, 10]
cov2 = [[1, 0], [0, 1]]
data2 = np.random.multivariate_normal(mean2, cov2, 150)

# Combine the datasets
data = np.vstack((data1, data2))
plt.scatter(data[:, 0], data[:, 1], s=5)
plt.title('Dataset with Two Gaussian Components')
plt.show()
Here, we generate 150 samples for each Gaussian component using different means (mean1 and mean2) and covariances (cov1 and cov2). The data is then combined and plotted.
Initialize Parameters
We need to initialize the parameters for the Gaussian components: means, covariances, and weights (probability of each component).
# Initial guesses for parameters
mean1_guess = [4, 4]
mean2_guess = [8, 8]
cov1_guess = [[1, 0], [0, 1]]
cov2_guess = [[1, 0], [0, 1]]
pi1, pi2 = 0.5, 0.5  # Initial weights for each component
These initial values are estimates that will be updated in the EM algorithm’s iterations.
Perform EM Algorithm
Now, let’s implement the EM algorithm, iterating through the E-step and M-step:
# EM Algorithm
def e_step(data, mean1, mean2, cov1, cov2, pi1, pi2):
    # Calculate the responsibilities (E-step)
    rv1 = multivariate_normal(mean1, cov1)
    rv2 = multivariate_normal(mean2, cov2)
    gamma1 = pi1 * rv1.pdf(data)
    gamma2 = pi2 * rv2.pdf(data)

    gamma_sum = gamma1 + gamma2
    gamma1 /= gamma_sum
    gamma2 /= gamma_sum

    return gamma1, gamma2

def m_step(data, gamma1, gamma2):
    # Update the parameters (M-step)
    N1 = np.sum(gamma1)
    N2 = np.sum(gamma2)

    mean1_new = np.sum(gamma1[:, np.newaxis] * data, axis=0) / N1
    mean2_new = np.sum(gamma2[:, np.newaxis] * data, axis=0) / N2

    cov1_new = (gamma1[:, np.newaxis] * (data - mean1_new)).T @ (data - mean1_new) / N1
    cov2_new = (gamma2[:, np.newaxis] * (data - mean2_new)).T @ (data - mean2_new) / N2

    pi1_new = N1 / len(data)
    pi2_new = N2 / len(data)

    return mean1_new, mean2_new, cov1_new, cov2_new, pi1_new, pi2_new

# Iterate until convergence
for _ in range(100):  # Limit iterations to prevent infinite loop
    gamma1, gamma2 = e_step(data, mean1_guess, mean2_guess, cov1_guess, cov2_guess, pi1, pi2)
mean1_guess, mean2_guess, cov1_guess, cov2_guess, pi1, pi2 = m_step(data, gamma1, gamma2)- E-step: The algorithm calculates the “responsibilities” for each data point, indicating the probability of the point belonging to each Gaussian component.
- M-step: The parameters (means, covariances, and weights) are updated based on these probabilities.
Plot the Final Estimated Density
Finally, we visualize the estimated Gaussian components based on the final parameter values:
# Visualize the estimated density
x, y = np.meshgrid(np.linspace(0, 15, 100), np.linspace(0, 15, 100))
pos = np.dstack((x, y))
rv1 = multivariate_normal(mean1_guess, cov1_guess)
rv2 = multivariate_normal(mean2_guess, cov2_guess)

plt.contour(x, y, rv1.pdf(pos), colors='blue', alpha=0.5)
plt.contour(x, y, rv2.pdf(pos), colors='red', alpha=0.5)
plt.scatter(data[:, 0], data[:, 1], s=5)
plt.title('Final Estimated Gaussian Components')
plt.show()
This code plots the estimated Gaussian distributions over the dataset, showing how the EM algorithm has modeled the data.
Gaussian Mixture Model (GMM)
A Gaussian Mixture Model (GMM) is a popular application of the EM algorithm. It is used to represent data as a mixture of multiple Gaussian distributions. In simple terms, GMM assumes that the data points are generated from several Gaussian distributions with unknown parameters. Each distribution represents a cluster or group within the data.
The EM algorithm is used to estimate the parameters of these Gaussian components, including their means, variances, and the probability of each cluster.
GMM is widely used for clustering tasks in machine learning, particularly when the clusters in the data have a roughly Gaussian (bell-shaped) distribution. It allows for soft clustering, meaning a data point can belong to multiple clusters with different probabilities.
Applications of EM Algorithm
The EM algorithm is versatile and is used across various fields in machine learning, beyond just Gaussian Mixture Models (GMM). Some common applications include:
- Image Segmentation: EM helps in segmenting images by identifying different regions based on pixel intensities. It can model the intensity values as a mixture of distributions and cluster pixels accordingly.
- Text Clustering: In Natural Language Processing (NLP), EM is used for clustering similar text documents by analyzing patterns and topics within the text data.
- Recommendation Systems: The algorithm can predict user preferences by filling in missing information, such as when users have not rated certain items. It estimates the probability of a user liking an item based on similar users’ behavior.
- Missing Data Imputation: EM is effective in dealing with incomplete datasets. It estimates the missing values based on observed data, allowing for a more accurate analysis.
These examples demonstrate the EM algorithm’s ability to work with hidden information, making it a crucial tool in many machine learning and data analysis tasks.
Advantages and Disadvantages of EM Algorithm
The EM algorithm has several advantages and disadvantages when applied in machine learning:
Advantages:
- Handles Missing Data: The EM algorithm is particularly effective at estimating missing data, making it valuable for datasets with incomplete information.
- Latent Variable Estimation: It is well-suited for models with latent variables, enabling accurate estimation of hidden factors influencing the data.
- Broad Applicability: The algorithm can be applied to a wide range of statistical models, including GMMs and other clustering and classification tasks.
- Efficiency: EM often converges quickly, making it efficient for various applications where quick parameter estimation is needed.
Disadvantages:
- Local Maxima: The algorithm may converge to a local maximum instead of the global maximum, depending on the initial parameter values. This means it might not always find the best solution.
- Initialization Sensitivity: The outcome heavily depends on the initial values chosen for the parameters, which can impact convergence and accuracy.
- Computational Complexity: For complex models or large datasets, the EM algorithm can become computationally expensive, as it requires multiple iterations through the entire dataset.
This balanced view highlights the strengths and limitations of the EM algorithm, providing insights into when and where it can be most effectively used.
Conclusion
The EM algorithm is a powerful technique for dealing with latent variables and estimating missing data in machine learning models. By iteratively refining parameter estimates through the Expectation and Maximization steps, it provides a robust solution for optimizing statistical models like Gaussian Mixture Models (GMMs). Despite its limitations, such as sensitivity to initialization and potential convergence to local maxima, the algorithm remains widely used in applications ranging from image segmentation to recommendation systems. As machine learning continues to evolve, the EM algorithm’s role in handling complex data structures and improving model accuracy is likely to grow further.


