Statistics plays a fundamental role in data analysis and data science, offering tools to uncover patterns and draw meaningful insights from data. It helps businesses, researchers, and policymakers make better decisions. One of the primary branches of statistics is descriptive statistics, which focuses on summarizing and organizing data to provide an easy-to-understand overview of large datasets.
Descriptive statistics is essential for understanding the basic structure of data by highlighting key features such as averages, variability, and distribution. It serves as the first step in statistical analysis, providing a foundation for further exploration using more complex techniques like inferential statistics.
What is Descriptive Statistics?
Descriptive statistics is a branch of statistics focused on summarizing and organizing data to make it easier to understand and interpret. It provides a way to describe the main characteristics of a dataset through various statistical measures without making predictions or drawing conclusions beyond the data at hand. The primary goal is to present data in a structured manner that highlights key insights.
This type of statistics is used to simplify large datasets by summarizing essential aspects, such as the central point and variability of the data. Measures of central tendency, such as the mean, median, and mode, describe the typical or average value within a dataset. In addition, measures of variability, including the range, variance, and standard deviation, provide insight into how spread out or consistent the data points are.
By organizing data into meaningful summaries, descriptive statistics helps analysts and decision-makers identify patterns, trends, and outliers quickly. For instance, summarizing sales data using averages and standard deviations allows businesses to assess performance across different periods.
In many cases, descriptive statistics also employs visual tools like histograms, bar charts, and scatter plots to represent data graphically. These visualizations make it easier to identify patterns that might not be immediately apparent from numerical summaries. Descriptive statistics plays an essential role in the early stages of data analysis, offering a comprehensive understanding of the data before further, more complex statistical techniques are applied.
Types of Descriptive Statistics
Descriptive statistics consists of various methods that provide a structured overview of data. These methods help in summarizing large datasets by focusing on key aspects, such as the central point, data spread, and relationships between variables. The main types include distribution, measures of central tendency, variability, and both univariate and bivariate statistics.
1. Distribution (Also Called Frequency Distribution)
Distribution describes how data points are spread across various values or ranges within a dataset. It helps summarize data by counting the frequency of each value or range. Frequency distributions make it easy to identify which values occur more frequently, highlighting trends or clusters within the data.
For example, a frequency distribution of student test scores might group the results into ranges, such as 80-90 or 90-100, showing how many students fall into each category. This type of distribution helps in identifying patterns within the data and is often visualized through tools like histograms or bar charts.
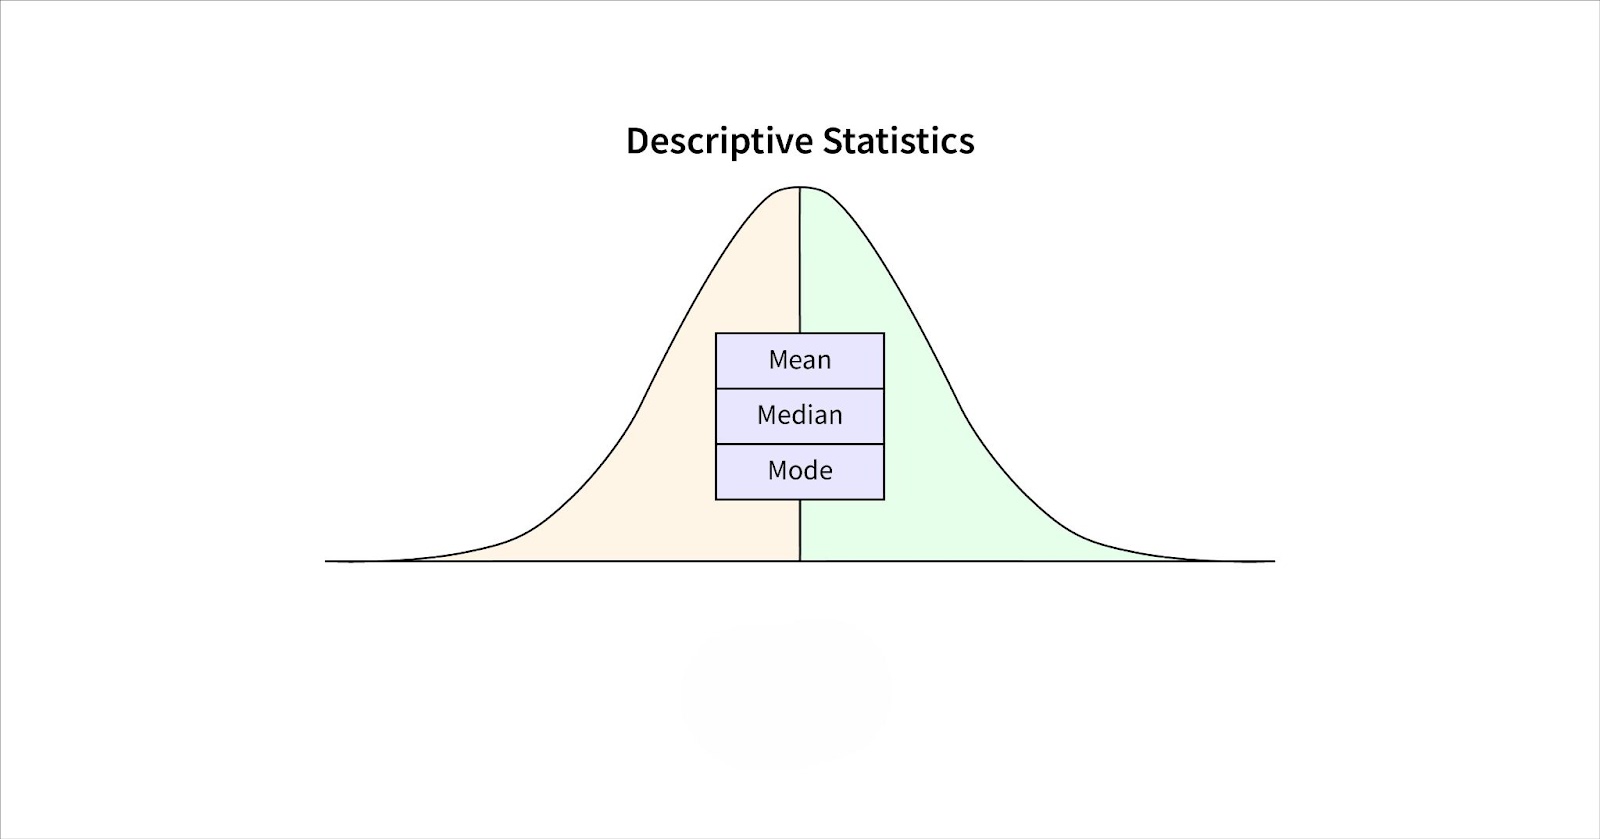
2. Measures of Central Tendency
Measures of central tendency summarize a dataset by identifying its central point or typical value. The three primary measures are:
- Mean: The average value of all data points in the dataset.
- Median: The middle value when data points are arranged in ascending or descending order.
- Mode: The most frequently occurring value in the dataset.
These measures help in understanding where most data points cluster and provide insights into the dataset’s overall pattern.
3. Variability (Also Called Dispersion)
Variability measures describe how spread out the data points are. They provide insight into the consistency of the dataset by showing whether values are closely packed or widely scattered. Common measures include:
- Range: The difference between the highest and lowest values.
- Variance: The average of the squared deviations from the mean.
- Standard Deviation: The square root of the variance, indicating the typical deviation from the mean.
Understanding variability is essential for interpreting the reliability of the data, as it shows how much individual data points differ from the central point.
4. Univariate Descriptive Statistics
Univariate statistics focus on analyzing a single variable at a time. For instance, calculating the mean and standard deviation of product prices in a store gives insights into average pricing and the variation across different products.
5. Bivariate Descriptive Statistics
Bivariate statistics analyze the relationship between two variables. For example, a scatter plot showing advertising expenditure versus sales reveals whether an increase in spending correlates with higher sales. This type of analysis is useful for identifying trends and relationships between variables.
Descriptive Statistics Examples
Descriptive statistics are widely used across various industries to summarize datasets and extract meaningful insights. Below are two real-world examples demonstrating how descriptive statistics helps in analyzing data and supporting decision-making.
Example 1: Sales Data
A retail company collects daily sales data from multiple stores to evaluate performance and make data-driven decisions. Using descriptive statistics, the company summarizes the dataset to extract key insights.
First, the mean daily sales are calculated to determine the average sales per day, giving a sense of typical store performance. If the average daily sales amount to ₹50,000, this becomes the baseline for evaluating whether performance on any given day was above or below average.
Next, the company calculates the median sales to account for any extreme values or outliers, such as unusually high sales during a holiday season. The median helps avoid skewing the analysis by showing the central point of sales performance.
To assess the variability in sales across different stores, the standard deviation is calculated. A low standard deviation indicates that most stores have similar sales, while a high value suggests significant variation.
Additionally, a frequency distribution groups the daily sales data into ranges, such as ₹40,000–₹50,000, ₹50,000–₹60,000, etc., helping the company identify patterns. This analysis guides future decisions, such as which products to promote or how to manage inventory efficiently.
Example 2: Medical Data
A hospital collects patient recovery times after surgery to evaluate the effectiveness of different treatment protocols. Descriptive statistics help the medical team summarize the data and draw insights about recovery patterns.
The mean recovery time offers a general idea of how long patients take to recover. For example, if the average recovery time is 10 days, this serves as a benchmark for evaluating new treatment methods.
The median recovery time is also analyzed to prevent extreme cases from distorting the results. If most patients recover within 7 to 10 days, the median will highlight this trend, even if a few outliers exist with much longer recovery times.
To understand the variability in recovery times, the hospital calculates the standard deviation. A high standard deviation indicates inconsistent recovery times, prompting the need for further investigation into factors influencing recovery.
By grouping the recovery times into intervals through frequency distribution, such as 5–7 days, 7–10 days, and 10+ days, the hospital identifies common recovery periods and evaluates the effectiveness of each treatment protocol. These insights are crucial for refining medical practices and improving patient outcomes.
Univariate vs. Bivariate Statistics
Descriptive statistics can be divided into univariate and bivariate analysis, depending on the number of variables being studied. Both methods help summarize data, but they differ in focus and purpose.
Univariate Statistics
Univariate statistics involve analyzing a single variable to understand its distribution, central tendency, and variability. This type of analysis answers questions such as: What is the average value? How much do the data points vary from the average?
For example, in a dataset of employee salaries, the mean salary represents the central tendency, while the range and standard deviation highlight the spread of salaries across the organization. A histogram can visualize the distribution of salaries, showing how frequently different salary ranges occur.
Univariate statistics provide insights into patterns within a single dataset, making it useful for assessing trends, identifying outliers, and understanding the basic characteristics of the data.
Bivariate Statistics
Bivariate statistics focus on analyzing the relationship between two variables. This method helps determine whether a relationship exists, and if so, how strong it is. Scatter plots and correlation coefficients are commonly used tools for bivariate analysis.
For example, a retail business might analyze the relationship between advertising expenditure and sales revenue. A scatter plot could reveal whether higher spending correlates with increased sales. The correlation coefficient quantifies the strength and direction of the relationship, with values ranging from -1 (perfect negative correlation) to +1 (perfect positive correlation).
Bivariate analysis is essential for understanding dependencies between variables, identifying trends, and supporting predictive modeling. It is often used in fields like economics, marketing, and social sciences to analyze how one factor influences another.
Descriptive Statistics and Visualizations
Visualizations play a crucial role in descriptive statistics by transforming numerical summaries into easily interpretable visual formats. Common visual tools include:
- Histograms: Display the frequency distribution of a dataset.
- Bar Charts: Compare categorical data across different groups.
- Scatter Plots: Show the relationship between two variables, identifying correlations or trends.
- Box Plots: Highlight the spread and central tendency of data while identifying potential outliers.
These visual tools help analysts quickly grasp patterns, trends, and variations that might not be obvious from raw numbers. For example, a histogram can reveal whether data is skewed, and a scatter plot can identify relationships between variables, guiding further analysis and decision-making.
Descriptive Statistics and Outliers
Outliers are data points that deviate significantly from the rest of the dataset. They can skew results, especially when using measures like the mean, leading to misinterpretations. For instance, in a salary dataset, a few extremely high salaries can distort the average, making it less representative.
To handle outliers, analysts use techniques such as:
- Trimming: Removing extreme values to focus on more representative data.
- Winsorizing: Replacing outliers with the nearest valid values to reduce their impact on the analysis.
Identifying and addressing outliers is essential for ensuring the accuracy and reliability of descriptive statistics. Proper handling allows analysts to draw meaningful insights while minimizing the distortion caused by extreme values.
Descriptive Statistics vs. Inferential Statistics
Descriptive and inferential statistics serve distinct purposes in data analysis. Descriptive statistics focuses on summarizing and organizing data, providing insights into patterns, averages, and variability within a specific dataset. In contrast, inferential statistics goes beyond the observed data, drawing conclusions about a population based on a sample.
Descriptive statistics employs tools such as mean, median, standard deviation, and frequency distributions to present data clearly. Inferential statistics, on the other hand, uses methods like hypothesis testing, confidence intervals, and regression analysis to make predictions or generalizations.
While descriptive statistics provides a snapshot of the existing data, inferential statistics aims to test hypotheses and make inferences about broader populations. Both methods complement each other, with descriptive statistics often serving as the foundation for more advanced inferential techniques.
Conclusion
Descriptive statistics plays a crucial role in summarizing and interpreting data, offering a clear picture of key patterns and trends. By organizing complex datasets into understandable summaries, it provides valuable insights that guide decision-making.
Moreover, descriptive statistics sets the stage for further statistical analysis, including inferential methods, ensuring that analysts can draw accurate conclusions from data. Its importance extends across various fields, making it an essential tool for both exploratory analysis and practical applications.
References:
- Descriptive Statistics: Definition, Overview, Types, and Examples
- Descriptive statistics – Wikipedia