Data Science interviews in 2025 are designed to test candidates on a wide range of topics. These interviews typically cover questions that evaluate foundational knowledge, practical skills, and real-world problem-solving abilities. Interviewers seek candidates who are familiar with both theoretical concepts and the latest advancements in the field.
This guide categorizes Data Science questions into the following sections: Basic, Intermediate, Advanced, Scenario-Based, Behavioral, Industry-Specific, and Coding. Whether you are a beginner or an advanced candidate, these questions and answers will help you prepare comprehensively for your Data Science interview in 2025.
Basic Data Science Interview Questions

1. What is Data Science?
Data Science is an interdisciplinary field that uses various methods, algorithms, and systems to extract insights and knowledge from structured and unstructured data. It combines elements of statistics, machine learning, data mining, and computer science to solve real-world problems.
In business contexts, Data Science is often used to make data-driven decisions by analyzing large datasets. For instance, a retail company might use Data Science to predict customer behavior, optimize pricing strategies, and recommend products based on past purchases.
2. Differentiate between Data Science and Data Analytics.
While Data Science is a broad field that covers everything from data collection to predictive modeling, Data Analytics focuses on analyzing historical data to generate actionable insights. Data Science often involves building models to predict future trends, whereas Data Analytics is used to describe past performance.
Data Analytics is typically used for decision-making, reporting, and performance assessment. In contrast, Data Science may involve creating algorithms and models that predict future behavior, such as customer retention or market demand.
3. What are the main differences between supervised and unsupervised learning?
Supervised learning uses labeled data to predict outcomes, while unsupervised learning works on data without labels, discovering hidden patterns and relationships.
- Supervised Learning: Involves a training process where the algorithm learns from labeled examples to predict the output. Common applications include fraud detection, spam classification, and medical diagnosis.
- Unsupervised Learning: Focuses on finding structures or patterns in the data. It’s often used for clustering and association tasks, like customer segmentation or market basket analysis.
4. Explain logistic regression and its application.
Logistic regression is used to model binary outcomes, where the dependent variable can take only two values, such as true/false or 0/1. The algorithm predicts the probability of the event happening by fitting a logistic curve to the data.
Applications of Logistic Regression:
- Predicting the probability of customer churn.
- Classifying emails as spam or not spam.
- Determining the likelihood of a medical condition based on patient data.
5. What is a confusion matrix?
A confusion matrix is a table used to evaluate the performance of a classification model. It shows the number of true positives, true negatives, false positives, and false negatives, which helps to calculate metrics like accuracy, precision, recall, and F1 score.
Example of a Confusion Matrix:
              | Predicted Positive | Predicted Negative |
---------------|--------------------|--------------------|
Actual Positive| True Positive (TP)  | False Negative (FN)|
Actual Negative| False Positive (FP) | True Negative (TN) |
6. What are precision and recall? How do you calculate them?
Precision is the ratio of correctly predicted positive observations to the total predicted positives.
$$Precision = \frac{TP}{TP + FP}$$
Recall (also called sensitivity) is the ratio of correctly predicted positive observations to all observations in the actual class.
$$Recall = \frac{TP}{TP + FN}$$
7. What is the significance of the p-value in statistical testing?
The p-value helps determine whether the observed results are statistically significant. A smaller p-value (usually less than 0.05) indicates strong evidence against the null hypothesis, suggesting that the result is not due to chance.
For example, in A/B testing, a p-value of 0.03 would mean there is a 3% probability that the observed difference between two versions occurred by chance, allowing the conclusion that the difference is statistically significant.
8. Explain the difference between a population and a sample.
- Population: The entire set of entities that are of interest in a particular study.
- Sample: A subset of the population, selected to represent the population in statistical analysis.
For example, if you are analyzing the voting behavior of all citizens in a country, the entire citizenry would be the population, while the group of individuals you survey would be the sample.
9. What is the bias-variance trade-off in machine learning?
The bias-variance trade-off describes the balance between two sources of error in machine learning models:
- Bias: Error due to overly simplistic models that fail to capture the complexity of the data (underfitting).
- Variance: Error due to models that are too complex and overly sensitive to fluctuations in the training data (overfitting).
The goal is to find a model with low bias and low variance to avoid both underfitting and overfitting.
10. What is overfitting, and how can it be avoided?
Overfitting occurs when a model learns not only the underlying pattern in the training data but also the noise, leading to poor generalization to new, unseen data.
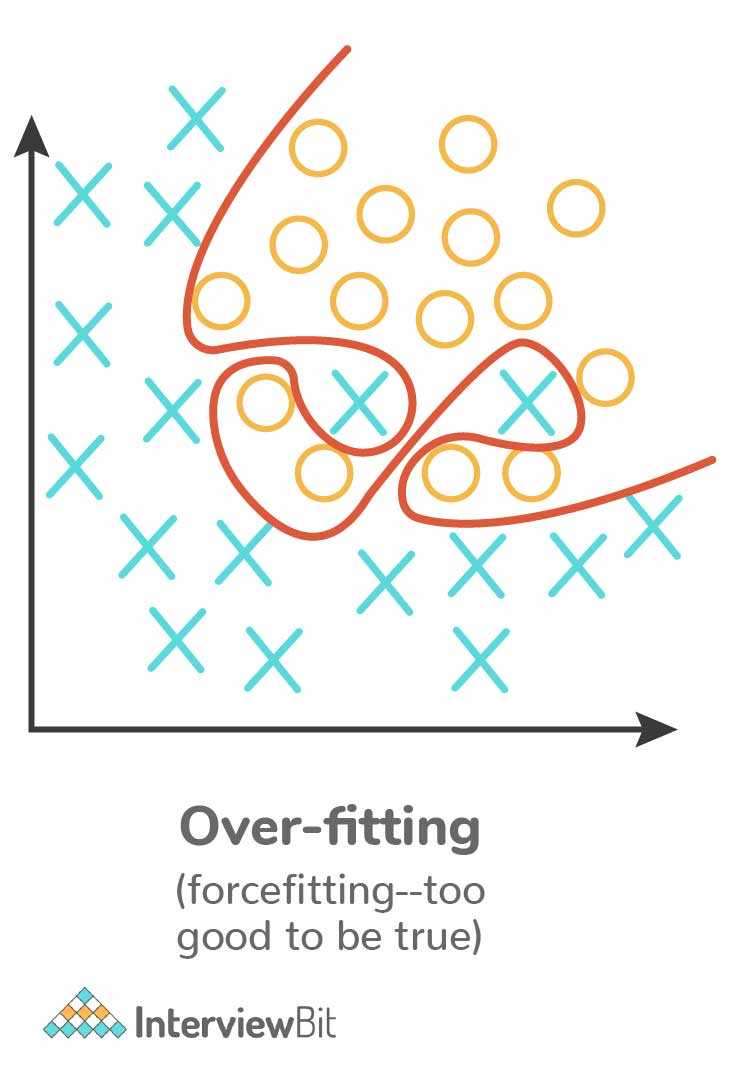
Ways to avoid overfitting:
- Cross-validation: Use techniques like K-fold cross-validation to evaluate the model on different subsets of data.
- Regularization: Apply L1 or L2 regularization to penalize large model coefficients.
- Pruning: For decision trees, reduce the depth of the tree to avoid capturing noise.
- Early Stopping: In iterative algorithms like gradient descent, stop training when performance on the validation set starts to degrade.
Intermediate Data Science Interview Questions

Source: SrataScratch
1. What are feature selection techniques in machine learning?
Feature selection techniques are used to reduce the number of input variables when building a predictive model. They help improve model performance and reduce overfitting by selecting the most important features from the dataset.
Feature Selection Techniques:
- Filter Methods: Select features based on their correlation with the outcome variable. These techniques rank features independently of the model, using metrics like Chi-Square, mutual information, or correlation coefficients.
- Wrapper Methods: Evaluate different subsets of features by training and testing a model on them. Recursive Feature Elimination (RFE) is an example of a wrapper method.
- Embedded Methods: Feature selection occurs during the model training process, where the model’s algorithm automatically selects the most relevant features (e.g., Lasso regression).
2. Explain dimensionality reduction and its benefits.
Dimensionality reduction refers to techniques that reduce the number of input variables in a dataset while retaining as much information as possible. This is essential for reducing model complexity, speeding up computation, and preventing overfitting, especially when dealing with high-dimensional datasets.
Benefits of Dimensionality Reduction:
- Simplifies models and improves interpretability.
- Reduces the risk of overfitting by eliminating irrelevant features.
- Decreases the time and space complexity of algorithms.
Common Dimensionality Reduction Techniques:
- Principal Component Analysis (PCA): Projects data onto new axes (principal components) that capture the most variance in the data.
- t-SNE: A non-linear technique used for visualizing high-dimensional data by projecting it into lower dimensions.
3. What is K-fold cross-validation?
K-fold cross-validation is a technique used to evaluate a machine learning model’s performance by dividing the dataset into K equal parts, or “folds.” The model is trained on K-1 folds and tested on the remaining fold. This process is repeated K times, each time with a different test fold, and the performance metrics are averaged.
Benefits of K-Fold Cross-Validation:
- Provides a more robust estimate of model performance than using a single train-test split.
- Reduces the risk of overfitting by evaluating the model on different subsets of data.
- Allows for better hyperparameter tuning by evaluating the model’s behavior across different folds.
4. Differentiate between deep learning and machine learning.
Deep learning is a subset of machine learning that uses neural networks with multiple layers (deep neural networks) to model complex patterns in data.
Key Differences:
- Machine Learning: Involves algorithms like decision trees, linear regression, and SVM that learn from data but rely on feature engineering.
- Deep Learning: Involves deep neural networks that automatically extract features from raw data, enabling it to handle tasks like image and speech recognition.
Applications of Deep Learning:
- Autonomous vehicles (self-driving cars).
- Natural language processing (NLP) tasks like machine translation and speech recognition.
- Image classification and object detection.
5. What is a decision tree, and how is it constructed?
A decision tree is a tree-like model used for classification and regression tasks. It splits the dataset into subsets based on the most significant feature at each node, creating branches that lead to decision outcomes.
Steps to Construct a Decision Tree:
- Select the feature that maximizes information gain or minimizes impurity (e.g., Gini index, entropy).
- Split the dataset into subsets based on the selected feature.
- Repeat the process for each subset until a stopping condition is met (e.g., maximum depth, minimum samples per leaf).
- The final decision is made at the leaf nodes.
Advantages of Decision Trees:
- Simple to interpret and visualize.
- Can handle both numerical and categorical data.
- Requires little data preprocessing, such as normalization or scaling.
6. How do you deal with missing data in a dataset?
Handling missing data is a critical step in the data preparation process. Several techniques can be used depending on the nature and amount of missing data:
- Remove Missing Data: If the missing data is negligible (e.g., less than 5%), removing rows or columns with missing values is a simple and effective approach.
- Imputation: Replace missing values with statistical measures such as the mean, median, or mode. For time series data, interpolation methods like forward or backward filling can be used.
- Predictive Imputation: Use models such as K-Nearest Neighbors (KNN) or regression techniques to predict missing values based on other features.
7. What is the importance of the learning rate in gradient descent?
The learning rate controls the size of the updates to the model parameters during each step of the gradient descent optimization process. It plays a critical role in determining the speed and accuracy of the model’s convergence to the optimal solution.
- High Learning Rate: If the learning rate is too high, the model may overshoot the optimal point and fail to converge, leading to instability.
- Low Learning Rate: If the learning rate is too low, the convergence process becomes slow, and the model might get stuck in a local minimum.
A well-chosen learning rate strikes a balance, ensuring that the model converges efficiently without diverging or oscillating.
8. Describe the ROC curve and how it is used in classification models.
The ROC (Receiver Operating Characteristic) curve is a graphical representation used to evaluate the performance of binary classification models. It plots the true positive rate (sensitivity) against the false positive rate (1-specificity) at different classification thresholds.
Key Metrics from the ROC Curve:
- True Positive Rate (TPR): Proportion of actual positives that are correctly identified by the model.
- False Positive Rate (FPR): Proportion of actual negatives that are incorrectly classified as positive.
The area under the ROC curve (AUC) provides a single metric that summarizes the model’s ability to distinguish between classes. A model with an AUC close to 1 is considered a good classifier.
9. What is cross-validation, and why is it used in model evaluation?
Cross-validation is a technique used to evaluate a machine learning model’s ability to generalize to unseen data. It helps prevent overfitting by training and testing the model on different subsets of the dataset.
Types of Cross-Validation:
- K-Fold Cross-Validation: The dataset is split into K folds, and the model is trained and tested K times, with each fold serving as the test set once.
- Leave-One-Out Cross-Validation (LOOCV): A special case where K is set to the total number of data points, meaning the model is tested on one data point at a time.
10. How do you evaluate the performance of a regression model?
The performance of a regression model is evaluated using various metrics that quantify how well the model’s predictions match the actual values:
Mean Squared Error (MSE): Measures the average squared difference between the predicted and actual values.
$$MSE = \frac{1}{n} \sum_{i=1}^{n} (y_i – \hat{y_i})^2$$
Root Mean Squared Error (RMSE): The square root of MSE, providing a more interpretable measure of error.
$$RMSE = \sqrt{MSE}$$
R-squared (R²): Measures the proportion of variance in the dependent variable that is predictable from the independent variables. R² ranges from 0 to 1, with higher values indicating better model fit.
Advanced Data Science Interview Questions

Source: 365 DataScience
1. What are eigenvalues and eigenvectors, and why are they important?
Eigenvalues and eigenvectors are fundamental concepts in linear algebra, widely used in data science for dimensionality reduction and feature extraction techniques such as Principal Component Analysis (PCA).
- Eigenvalues: Scalar values that give information about the variance explained by each principal component in PCA.
- Eigenvectors: Vectors that indicate the direction of the data spread.
Applications in Data Science
Principal Component Analysis (PCA): Eigenvectors define the new axes onto which the data is projected, while eigenvalues indicate the importance of each axis.
In PCA, we solve the following equation:
$$A v = \lambda v$$
- Where:
- $A$ is the data matrix.
- $v$ is the eigenvector.
- λ is the eigenvalue corresponding to $v$.
2. Explain the concept of a Support Vector Machine (SVM).
Support Vector Machine (SVM) is a supervised learning algorithm primarily used for classification tasks. The SVM algorithm works by finding the hyperplane that best separates the data points of different classes with the maximum margin.
Key Concepts of SVM:
- Hyperplane: A decision boundary that separates data points in different classes.
- Margin: The distance between the hyperplane and the nearest data points of any class.
- Support Vectors: The data points that are closest to the hyperplane and influence its position.
SVM can be extended to non-linear decision boundaries by using kernel tricks, which project the data into a higher-dimensional space where it becomes linearly separable.
3. How do random forests work?
Random forests are an ensemble learning technique used for both classification and regression tasks. They build multiple decision trees from random subsets of the data and combine their predictions to improve model accuracy and robustness.
How Random Forests Work:
- Bootstrap Aggregating (Bagging): Random samples from the dataset are used to train individual decision trees.
- Random Feature Selection: At each split in the tree, a random subset of features is considered, making the trees less correlated.
- Ensemble Voting (for classification) or Averaging (for regression): The final prediction is made by averaging the predictions of all the trees.
Advantages of Random Forests:
- Reduced Overfitting: By averaging multiple decision trees, random forests avoid overfitting.
- Better Generalization: Random forests tend to perform better on unseen data compared to a single decision tree.
4. What is natural language processing (NLP), and how is it used in Data Science?
Natural Language Processing (NLP) is a field of artificial intelligence and data science that focuses on the interaction between computers and human language. It involves enabling computers to process, analyze, and generate human language in a meaningful way.
Common NLP Tasks:
- Sentiment Analysis: Determining whether a piece of text expresses positive, negative, or neutral sentiments.
- Named Entity Recognition (NER): Identifying and classifying entities such as people, organizations, and locations in text.
- Machine Translation: Automatically translating text from one language to another.
- Text Summarization: Creating concise summaries of longer text documents.
NLP is widely used in applications such as chatbots, automated customer support, language translation services, and search engines.
5. Explain the difference between L1 and L2 regularization.
L1 and L2 regularization are techniques used to prevent overfitting in machine learning models by adding a penalty term to the cost function.
L1 Regularization (Lasso): Adds the absolute value of the coefficients to the cost function.
$$Lasso Loss = \sum_{i=1}^{n} (y_i – \hat{y_i})^2 + \lambda \sum_{j=1}^{p} |\beta_j|$$
L1 regularization encourages sparsity, meaning that some coefficients become exactly zero, effectively selecting a subset of the features.
L2 Regularization (Ridge): Adds the square of the coefficients to the cost function.
$$Ridge Loss = \sum_{i=1}^{n} (y_i – \hat{y_i})^2 + \lambda \sum_{j=1}^{p} \beta_j^2$$
L2 regularization shrinks all coefficients, but none of them become zero. It helps in reducing model complexity without eliminating features.
6. What is reinforcement learning, and where can it be applied?
Reinforcement learning is a type of machine learning where an agent learns by interacting with an environment, receiving feedback in the form of rewards or punishments based on its actions. The agent aims to maximize its cumulative reward by learning the best strategy, known as the policy.
Reinforcement Learning Components:
- Agent: The decision-maker.
- Environment: The world in which the agent operates.
- Action: The moves made by the agent.
- Reward: Feedback from the environment after the agent’s action.
Applications of Reinforcement Learning:
- Game AI: Reinforcement learning is used in games such as Chess, Go, and Atari to develop agents that can play at a superhuman level.
- Autonomous Vehicles: Used in decision-making for self-driving cars, where the car learns to navigate by receiving feedback from the environment.
7. Explain Generative Adversarial Networks (GANs) and their applications.
Generative Adversarial Networks (GANs) are a type of neural network architecture designed to generate realistic data. GANs consist of two neural networks, a generator and a discriminator, that compete with each other.
- Generator: Generates fake data (e.g., images, text) that mimics real data.
- Discriminator: Tries to distinguish between real and fake data generated by the generator.
The objective of the GAN is to train the generator to produce data that is indistinguishable from real data, while the discriminator gets better at detecting fake data.
Applications of GANs:
- Image Generation: Creating realistic images of faces, landscapes, and other objects.
- Data Augmentation: Generating synthetic data to augment limited datasets for training models.
- Art and Design: Creating artwork, music, and designs using generative models.
8. What is the exploding gradient problem in deep learning?
The exploding gradient problem occurs when gradients grow exponentially during the backpropagation process, leading to unstable updates to the model weights. This often happens in deep neural networks with many layers, causing the model to diverge or fail to converge.
Solutions to the Exploding Gradient Problem:
- Gradient Clipping: Limits the size of gradients during training to prevent them from growing too large.
- Weight Initialization: Use proper weight initialization techniques (e.g., Xavier or He initialization) to prevent the gradients from becoming too large or too small.
- Batch Normalization: Normalize the inputs to each layer to stabilize the training process.
9. What are autoencoders, and how are they used for data compression?
Autoencoders are neural networks used for unsupervised learning tasks such as data compression and anomaly detection. They work by encoding the input data into a compressed representation (encoding) and then reconstructing it from the encoding (decoding).
Components of Autoencoders:
- Encoder: Maps the input data to a lower-dimensional space (compressed representation).
- Decoder: Reconstructs the original input data from the compressed representation.
Applications of Autoencoders:
- Data Compression: Reducing the size of high-dimensional data without losing important information.
- Anomaly Detection: Identifying outliers by detecting data points that are poorly reconstructed by the autoencoder.
- Denoising: Removing noise from data by training the autoencoder to reconstruct clean data from noisy inputs.
10. Describe Markov chains and their use in predictive modeling.
A Markov chain is a stochastic model that describes a sequence of possible events in which the probability of each event depends only on the state attained in the previous event (i.e., memoryless property).
Key Concepts in Markov Chains:
- States: The possible outcomes or conditions.
- Transition Probability: The probability of moving from one state to another.
- Steady-State Probability: The long-term probability of being in each state.
Applications of Markov Chains:
- Predictive Text: Markov chains are used in text generation models that predict the next word based on the previous words.
- Weather Prediction: Predicting future weather conditions based on current conditions.
- Customer Behavior Modeling: Understanding how customers transition between different stages of the buying process.
Scenario-Based Interview Questions

1. Given a dataset with missing values, how would you handle them?
Handling missing data is a critical step in the data preprocessing phase, as it can affect the performance of the model if not handled properly. Depending on the nature and extent of missing data, several techniques can be used:
- Remove Missing Data: If the number of missing values is relatively small (e.g., less than 5% of the total data), you can remove rows or columns that contain missing data. This is the simplest approach, but it should be used cautiously, as it can reduce the amount of usable data.
- Imputation: If a significant amount of data is missing, imputing missing values with statistical measures such as the mean, median, or mode can be effective. For example, missing values in numerical data can be replaced with the mean of the column, while categorical data can be replaced with the mode.
- Advanced Techniques: For more complex datasets, you can use predictive models such as K-Nearest Neighbors (KNN) or regression to impute missing values based on other available data points.
In some cases, you can also use algorithms that can handle missing values natively, such as decision trees and random forests.
2. You’ve built a model with 96% accuracy. Why shouldn’t you be satisfied?
While a model with 96% accuracy might sound impressive, accuracy alone can be misleading, especially in cases of imbalanced datasets. If the dataset is heavily skewed towards one class (e.g., 90% of the data belongs to class A), a model that predicts class A every time will achieve high accuracy without actually learning anything useful about class B.
In such cases, accuracy is not a sufficient measure of model performance. Instead, you should look at other metrics such as precision, recall, F1 score, and the confusion matrix to get a more complete picture of the model’s performance. Additionally, performing cross-validation on your model ensures that it generalizes well to unseen data.
3. You’re given a time-series dataset. How would you check if it’s stationary
A time-series dataset is stationary if its statistical properties, such as the mean, variance, and autocorrelation, remain constant over time. Non-stationary data can introduce challenges in forecasting models, so it’s important to check for stationarity before proceeding with time-series analysis.
Steps to Check for Stationarity:
- Visual Inspection: Plot the data over time and check for trends or seasonality. A non-stationary dataset will typically exhibit upward or downward trends.
- Statistical Tests: Use the Augmented Dickey-Fuller (ADF) test or the Kwiatkowski-Phillips-Schmidt-Shin (KPSS) test to statistically test for stationarity. A low p-value in the ADF test indicates that the data is stationary.
- Differencing: If the data is non-stationary, apply differencing to remove trends or seasonality. Differencing is the process of subtracting the previous observation from the current observation.
If the differenced data is stationary, you can proceed with forecasting models such as ARIMA.
4. A website offers two types of coupons to users. How would you assess which one leads to more conversions?
This is a classic A/B testing scenario. You can compare the performance of the two types of coupons by conducting an experiment and measuring the conversion rates for each group.
Steps for A/B Testing:
- Divide Users into Two Groups: Randomly assign users to either Group A (Coupon A) or Group B (Coupon B).
- Collect Data: Track the conversion rates for each group over a specified period.
- Statistical Significance: Use statistical tests like the Chi-Square test or the z-test to determine whether the difference in conversion rates between the two groups is statistically significant. A low p-value (typically less than 0.05) indicates that the difference is not due to random chance.
By comparing the conversion rates and ensuring the results are statistically significant, you can determine which coupon is more effective at driving conversions.
5. Given a dataset of customer purchases, how would you build a recommendation system
To build a recommendation system, there are two main approaches: Collaborative Filtering and Content-Based Filtering.
- Collaborative Filtering: This method relies on the preferences of similar users to make recommendations. There are two types of collaborative filtering:
- User-Based Collaborative Filtering: Recommends items to a user based on the preferences of users with similar behavior.
- Item-Based Collaborative Filtering: Recommends items similar to those the user has already interacted with.
- Content-Based Filtering: This method recommends items based on the features of the items themselves and the user’s past interactions with similar items. For example, if a customer buys a lot of electronic gadgets, the system will recommend more products from the electronics category.
In practice, hybrid systems combining both approaches often yield the best results.
Algorithmic Approach:
- Matrix Factorization: Techniques like Singular Value Decomposition (SVD) can be used to break down the user-item interaction matrix into latent factors that capture user preferences and item features.
- Evaluation: Use metrics like precision, recall, and F1 score to evaluate the effectiveness of the recommendation system.
6. You have a large dataset that doesn’t fit into memory. What steps would you take to handle it?
When dealing with datasets that don’t fit into memory, there are several strategies you can employ to process the data efficiently:
- Batch Processing: Split the data into smaller batches that can fit into memory. You can load each batch, process it, and then load the next batch.
- Data Streaming: Use data streaming techniques to process data as it is read from disk or an external source, instead of loading the entire dataset into memory at once. Libraries like Apache Kafka and Dask are useful for implementing this approach.
- Distributed Computing: Use distributed frameworks like Apache Spark or Hadoop, which allow you to process large datasets across multiple machines in parallel.
By implementing these strategies, you can process large datasets without running out of memory.
7. How would you optimize a machine learning algorithm for faster training times?
Optimizing machine learning algorithms for faster training times is crucial when dealing with large datasets or complex models. Here are several techniques to speed up training:
- Dimensionality Reduction: Reduce the number of input features using techniques like PCA or feature selection to decrease computation time.
- Use Stochastic Gradient Descent (SGD): Instead of computing the gradient for the entire dataset, compute it for small, random batches of data. This speeds up training and reduces memory usage.
- Early Stopping: Monitor the model’s performance on a validation set and stop training when performance starts to degrade, avoiding unnecessary epochs.
- Parallelization and GPUs: Use parallel computing resources and GPUs to accelerate training, especially for deep learning models.
- Hyperparameter Tuning: Use grid search or random search to find the optimal hyperparameters that reduce training time without sacrificing performance.
8. What approach would you take to solve an imbalanced dataset problem?
Imbalanced datasets occur when one class is significantly underrepresented compared to other classes, which can lead to biased model predictions. Here are several techniques to handle imbalanced data:
- Resampling: You can either oversample the minority class (e.g., using SMOTE – Synthetic Minority Over-sampling Technique) or undersample the majority class to balance the dataset.
- Class Weights: Assign higher weights to the minority class in the loss function to penalize the model more heavily for misclassifying minority class samples.
- Anomaly Detection Algorithms: For extreme imbalance, treat the problem as an anomaly detection task, where the minority class is the “anomaly.”
Evaluation Metric Considerations: Instead of relying on accuracy, use metrics like precision, recall, F1 score, or the area under the ROC curve (AUC) to evaluate model performance.
9. If a client requested feature engineering for a financial dataset, how would you approach it?
Feature engineering is crucial for improving model performance. For a financial dataset, you would follow these steps:
- Domain Knowledge: Understand key financial metrics such as revenue, profit margin, expenses, and credit risk factors. Collaborate with domain experts to extract meaningful features.
- Feature Creation: Create new features from existing data, such as calculating ratios (e.g., debt-to-income ratio), log transformations of skewed data, and aggregating transactional data over time windows.
- Handling Missing Data: Since financial datasets often have missing values, imputation techniques or interpolation can be applied.
- Categorical Encoding: Convert categorical financial variables, like account type or customer segment, into numerical features using one-hot encoding or target encoding.
10. You’ve noticed data drift in a deployed model. How would you handle it?
Data drift occurs when the statistical properties of the input data change over time, reducing the model’s predictive accuracy. To handle data drift:
- Monitor Model Performance: Continuously track performance metrics (e.g., accuracy, F1 score) to detect significant changes.
- Retrain the Model: Periodically retrain the model on new data to ensure it adapts to the changing distribution.
- Use Online Learning: Implement online learning algorithms that update the model incrementally as new data becomes available.
- Implement a Feedback Loop: Collect feedback from the model’s predictions and use it to improve future predictions.
Behavioral & Soft Skill Questions

Source: 24/7 Talent
1. How do you typically handle tight deadlines on Data Science projects?
Handling tight deadlines requires a combination of technical and time management skills. My approach involves breaking the project into smaller, manageable tasks and prioritizing them based on their importance and urgency. I use tools such as Trello or Jira to track progress and ensure that I’m meeting the deadlines. If necessary, I communicate with stakeholders early to adjust expectations or request additional resources. Additionally, automation tools and scripting can speed up repetitive tasks like data preprocessing, freeing up more time for complex analysis.
2. Describe a situation where you had to work in a cross-functional team. How did you contribute?
In one of my projects, I worked with a cross-functional team that included data engineers, product managers, and marketing professionals. My role as a Data Scientist was to provide insights from customer data to inform marketing strategies. I collaborated closely with the data engineers to ensure that the data pipeline was set up efficiently, and I worked with product managers to understand the business objectives. I contributed by building predictive models that identified customer segments and their purchasing behavior, helping the marketing team create targeted campaigns. My ability to communicate complex data insights in simple terms helped bridge the gap between technical and non-technical team members.
3. Can you explain a challenging Data Science project you’ve worked on?
One of the most challenging projects I worked on was developing a predictive model for customer churn for a telecom company. The dataset was highly imbalanced, with only a small percentage of customers classified as churners. I applied several techniques to handle the imbalance, including oversampling the minority class using SMOTE and adjusting class weights in the model. I also performed extensive feature engineering, deriving new features from customer call records, usage patterns, and payment history. After multiple iterations and cross-validation, I was able to create a model that significantly improved the company’s ability to predict customer churn, allowing them to take proactive measures to retain customers.
4. What is your approach to continuous learning and staying updated in Data Science?
Continuous learning is critical in Data Science, given the rapidly evolving nature of the field. I regularly take online courses on platforms like Coursera and Udemy to deepen my knowledge of new tools and algorithms. I also follow industry blogs, read research papers, and participate in Data Science communities on GitHub, Stack Overflow, and Kaggle. Attending webinars, conferences, and meetups helps me stay connected with industry trends and advancements. Additionally, I frequently experiment with new algorithms and techniques in personal projects to keep my practical skills sharp.
5. Tell us about a time when you disagreed with a team member on a data strategy. How did you resolve it?
In one project, a colleague and I had differing opinions on how to handle missing data. They suggested removing rows with missing values, while I believed that imputing values would preserve more data and lead to better model performance. Instead of pushing my approach, I suggested that we run both methods and compare their impact on model accuracy. After conducting A/B testing, we found that imputing the data resulted in better model performance. This collaborative approach allowed us to make a data-driven decision and fostered a positive team dynamic.
6. How do you prioritize tasks when working on multiple Data Science projects simultaneously?
When managing multiple projects, I prioritize tasks based on their urgency, business impact, and dependencies. I often start by meeting with stakeholders to align expectations and clarify deadlines. I use project management tools like Asana or Jira to organize my tasks and maintain a clear overview of each project’s progress. I focus on completing high-impact tasks that move the project forward and delegate or automate smaller, repetitive tasks when possible. Time-blocking techniques and daily task reviews help me stay focused and prevent context switching from slowing me down.
7. What’s your most significant professional failure, and what did you learn from it?
In one project, I over-engineered a predictive model by adding too many features and overly complex algorithms, hoping it would outperform a simpler model. The model performed well on the training data but struggled with overfitting on the test data. I learned that sometimes, simpler models with fewer features and proper regularization perform better than more complex ones. This experience taught me to focus on model interpretability and to prioritize simplicity and generalization over complexity.
8. How do you handle criticism of your models or results from clients or stakeholders?
I welcome constructive criticism as it provides an opportunity for improvement. When receiving feedback, I listen carefully to the concerns and ask clarifying questions to fully understand the issue. I then assess whether the criticism is related to the data, the model, or how the results were communicated. If the model’s performance needs improvement, I make adjustments and present the updated results. If the feedback is about the communication of insights, I make an effort to clarify the findings and ensure that the stakeholders understand the key takeaways. I maintain an open, collaborative approach throughout the process.
9. Describe a time when you had to communicate complex technical information to a non-technical audience.
In one of my previous roles, I had to present the findings of a machine learning model to a group of business stakeholders who had limited technical knowledge. The model was designed to predict customer churn, and while the stakeholders were interested in the outcome, they didn’t need to understand the technical details of the model itself. I focused on explaining the key insights—such as the factors that contributed most to customer churn—in simple terms, using visualizations to illustrate my points. This helped the stakeholders make informed business decisions without getting bogged down in technical jargon.
10. What is your preferred working style – individual, small team, or large team?
I’m comfortable working in any environment—whether individually or as part of a team. When working individually, I enjoy the autonomy and ability to focus deeply on complex problems. However, I also value the collaboration and diverse perspectives that come from working in small teams. In a team setting, I appreciate the opportunity to exchange ideas, learn from others, and contribute to shared goals. In larger teams, I’ve learned to balance communication and collaboration across multiple stakeholders, ensuring that everyone stays aligned.
Industry-Specific Interview Questions

Source: Big Interview
1. What specific Data Science challenges are unique to the healthcare industry?
In healthcare, Data Science faces several unique challenges, including:
- Data Privacy and Security: Healthcare data is highly sensitive, and strict regulations like HIPAA (in the U.S.) dictate how it can be stored, shared, and analyzed. Ensuring data privacy while gaining insights from patient data is a major challenge.
- Data Heterogeneity: Healthcare data comes from various sources such as Electronic Health Records (EHRs), medical imaging, clinical notes, and wearable devices. Integrating and standardizing these different formats into a cohesive dataset is complex.
- Bias and Fairness: Ensuring fairness in healthcare models is crucial. Models must be free from bias to avoid any form of discrimination in medical treatment recommendations.
Application Example:
Predicting patient outcomes using machine learning models can help allocate medical resources more effectively, but these models must be accurate, explainable, and compliant with privacy laws.
2. How would you use Data Science in marketing to improve customer engagement?
In marketing, Data Science can significantly improve customer engagement through:
- Customer Segmentation: Using clustering techniques like k-means or hierarchical clustering to group customers based on behavior, preferences, and purchasing patterns. This allows marketers to target specific groups with tailored content.
- Predictive Analytics: Machine learning models can predict customer lifetime value (CLV), churn, or the likelihood of making a purchase. Marketers can use this information to develop targeted campaigns that maximize ROI.
- A/B Testing: Running A/B tests on different marketing strategies and using statistical analysis to determine the most effective methods for customer engagement.
Application Example:
By analyzing customer interaction data, a marketing team could create personalized email campaigns, improving click-through rates and conversion rates.
3. Explain how Data Science can optimize supply chain management.
Supply chain management benefits from Data Science by using predictive analytics and optimization techniques to improve efficiency, reduce costs, and forecast demand.
- Demand Forecasting: Time series models like ARIMA or machine learning algorithms can be used to forecast future demand for products, helping businesses optimize inventory levels and reduce the risk of stockouts or overstock.
- Route Optimization: Using algorithms like Dijkstra’s or linear programming, Data Science can optimize transportation routes, reducing fuel costs and delivery times.
- Supplier Risk Management: Data Science models can analyze supplier performance data and external factors (like geopolitical risks) to predict potential disruptions in the supply chain, allowing companies to prepare for contingencies.
Application Example:
A retail company could use predictive analytics to forecast which products will experience high demand during the holiday season, ensuring they have adequate stock in their distribution centers.
4. What is the role of Data Science in fraud detection within the finance sector?
Fraud detection is one of the most important applications of Data Science in the finance sector. It involves using machine learning algorithms to identify unusual patterns in transactions that may indicate fraudulent activity.
Approaches to Fraud Detection:
- Supervised Learning: Train models on historical fraud data (e.g., using decision trees or logistic regression) to predict whether a transaction is fraudulent.
- Unsupervised Learning: Use anomaly detection techniques (e.g., Isolation Forest, autoencoders) to identify unusual behavior in real-time transactions.
- Behavioral Analytics: Track customer transaction patterns and use models to flag deviations from normal behavior as potential fraud.
Application Example:
Credit card companies use fraud detection algorithms that can flag suspicious transactions in real-time, automatically sending alerts to customers to verify the legitimacy of the activity.
5. How can Data Science be used to enhance recommendation systems in e-commerce?
Data Science powers recommendation systems by analyzing user behavior and preferences to suggest products that users are likely to purchase.
Techniques Used in Recommendation Systems:
- Collaborative Filtering: Recommends items based on the preferences of similar users. This can be done through user-based or item-based collaborative filtering.
- Content-Based Filtering: Recommends products based on the user’s history, matching the features of previously interacted items with similar items.
- Hybrid Systems: Combine both collaborative filtering and content-based filtering to provide more accurate and personalized recommendations.
Application Example:
Amazon’s recommendation system uses collaborative filtering to suggest products based on a customer’s purchase history and the behavior of similar customers. This enhances the shopping experience and increases sales.
6. Describe the application of predictive analytics in the retail industry.
Predictive analytics helps retailers forecast demand, optimize pricing, and improve customer experience by analyzing historical data and predicting future trends.
Key Applications:
- Demand Forecasting: Retailers use predictive models to forecast future demand for products, helping them stock inventory efficiently.
- Personalized Marketing: Predictive models analyze customer data to deliver personalized product recommendations and targeted promotions.
- Price Optimization: Retailers use algorithms to adjust prices dynamically based on demand, competition, and other factors, maximizing profits while remaining competitive.
Application Example:
A retail chain might use predictive analytics to anticipate spikes in demand for certain products before the holiday season, enabling them to adjust inventory levels accordingly.
7. What are the key differences between Data Science applications in the automotive industry versus tech startups?
The automotive industry and tech startups differ in how they apply Data Science due to the distinct nature of their data and business goals.
Automotive Industry:
- Predictive Maintenance: Analyzing sensor data from vehicles to predict when parts will fail, allowing manufacturers to perform maintenance before breakdowns occur.
- Autonomous Vehicles: Using deep learning and computer vision algorithms to enable self-driving cars to recognize objects and navigate roads safely.
Tech Startups:
- Product Development: Data Science is used to analyze user behavior, conduct A/B testing, and gather feedback to continuously improve products and features.
- Growth and Retention: Startups often rely on data to drive customer acquisition, retention, and growth through personalized marketing and recommendation systems.
8. How does Data Science contribute to decision-making in the public sector?
Data Science plays a crucial role in decision-making for government agencies by helping to analyze vast amounts of data for better policy decisions, resource allocation, and public services.
Applications in the Public Sector:
- Healthcare Policy: Data Science is used to analyze public health data, track disease outbreaks, and inform healthcare policies.
- Urban Planning: Governments use predictive models to forecast population growth, traffic patterns, and housing needs, ensuring infrastructure meets future demands.
- Fraud Detection: Public sector agencies use anomaly detection to identify and prevent fraud in welfare programs, tax systems, and procurement.
Application Example:
During the COVID-19 pandemic, governments worldwide used Data Science to model infection rates, assess the impact of lockdowns, and allocate healthcare resources effectively.
9. What role does Data Science play in improving cybersecurity
In cybersecurity, Data Science is used to detect and prevent security breaches by identifying patterns of malicious activity, predicting vulnerabilities, and automating response mechanisms.
Key Applications in Cybersecurity:
- Anomaly Detection: Machine learning models are trained to detect unusual network activity that may indicate a cyberattack.
- Threat Intelligence: Data Science helps analyze logs, threat feeds, and other data to predict potential attack vectors and vulnerabilities.
- Automated Response: AI-based systems can automatically respond to certain types of attacks by isolating compromised systems or blocking malicious traffic.
Application Example:
Banks use Data Science to monitor network traffic for unusual behavior that might indicate a hacking attempt. If a potential breach is detected, the system can trigger an automatic response to contain the threat.
10. Discuss the ethical considerations when using Data Science in social media platforms.
Data Science on social media platforms raises significant ethical concerns, particularly related to privacy, data ownership, and algorithmic bias.
Ethical Issues:
- Data Privacy: Social media platforms collect massive amounts of personal data, and ensuring user privacy while using that data for targeted advertising is a delicate balance.
- Algorithmic Bias: Algorithms that decide what content to show users can perpetuate bias, leading to filter bubbles and reinforcing stereotypes.
- Misinformation: Data-driven algorithms that prioritize engagement can inadvertently promote misinformation, as sensational content tends to generate more clicks.
Application Example:
Facebook and other platforms have faced scrutiny for how they use Data Science to target ads, with concerns over whether this practice respects user privacy and whether it contributes to political polarization.
Coding Interview Questions

Source: Medium
1. Write a Python program to calculate the Euclidean distance between two points.
The Euclidean distance between two points (x1,y1)(x_1, y_1)(x1,y1)$ and $(x2,y2)(x_2, y_2)(x2,y2) is calculated as:
$$d = \sqrt{(x_2 – x_1)^2 + (y_2 – y_1)^2}$$
Here’s how you can implement it in Python:
import math

def euclidean_distance(point1, point2):
    return math.sqrt(sum((x - y) ** 2 for x, y in zip(point1, point2)))

# Example
p1 = (1, 2)
p2 = (4, 6)
print(euclidean_distance(p1, p2))

# Output: 5.0
2. How would you reverse a string in Python?
In Python, you can reverse a string using slicing. Here’s a simple function to reverse a string:
def reverse_string(s):
    return s[::-1]

# Example
string = "DataScience"
print(reverse_string(string))
# Output: ecneicSataD
3. Write a SQL query to find the second highest salary in an employee table.
In SQL, you can find the second-highest salary by using the DISTINCT keyword and the LIMIT clause in combination with an ORDER BY. Here’s a query to achieve this:
SELECT MAX(salary) AS SecondHighestSalary
FROM employee
WHERE salary < (SELECT MAX(salary) FROM employee);
4. In Python, how would you calculate the eigenvalues and eigenvectors of a matrix?
You can use the numpy library to compute the eigenvalues and eigenvectors of a matrix.
import numpy as np

# Define a matrix
A = np.array([[3, 1], [2, 4]])

# Calculate eigenvalues and eigenvectors
eigenvalues, eigenvectors = np.linalg.eig(A)

print("Eigenvalues:", eigenvalues)
print("Eigenvectors:\n", eigenvectors)
In linear algebra, the eigenvalue equation is:
$$A \cdot v = \lambda \cdot v$$
Where:
- $A$ is the matrix.
- $v$ is the eigenvector.
- λ is the eigenvalue corresponding to $v$.
5. Write a program to implement a basic decision tree algorithm.
Here’s a basic implementation of a decision tree using the sklearn library:
from sklearn.datasets import load_iris
from sklearn.tree import DecisionTreeClassifier
from sklearn.model_selection import train_test_split

# Load dataset
iris = load_iris()
X = iris.data
y = iris.target

# Split the dataset into training and test sets
X_train, X_test, y_train, y_test = train_test_split(X, y, test_size=0.2, random_state=42)

# Train a decision tree classifier
clf = DecisionTreeClassifier()
clf.fit(X_train, y_train)

# Predict and print accuracy
accuracy = clf.score(X_test, y_test)
print(f"Decision Tree Accuracy: {accuracy:.2f}")
6. How would you optimize a linear regression model in Python?
You can optimize a linear regression model by tuning hyperparameters, applying regularization, and ensuring proper preprocessing of the data. Here’s an example using Lasso regularization with sklearn:
from sklearn.linear_model import Lasso
from sklearn.model_selection import GridSearchCV
from sklearn.datasets import make_regression

# Generate a regression dataset
X, y = make_regression(n_samples=100, n_features=2, noise=0.1)

# Initialize Lasso regression
lasso = Lasso()

# Define the grid of hyperparameters
param_grid = {'alpha': [0.1, 0.5, 1.0, 10.0]}

# Perform grid search to find the best hyperparameter
grid_search = GridSearchCV(lasso, param_grid, cv=5)
grid_search.fit(X, y)

# Print the best alpha value
print(f"Best alpha: {grid_search.best_params_['alpha']}")
7. Write a Python function to detect outliers in a dataset.
Outliers can be detected using the Interquartile Range (IQR) method, where values outside $1.5×IQR1.5 \times IQR1.5×IQR$ are considered outliers.
The interquartile range is calculated as:
$$IQR = Q3 – Q1$$
Where Q1 is the 25th percentile, and Q3 is the 75th percentile.
import numpy as np

def detect_outliers(data):
    q1, q3 = np.percentile(data, [25, 75])
    iqr = q3 - q1
    lower_bound = q1 - 1.5 * iqr
    upper_bound = q3 + 1.5 * iqr
    return [x for x in data if x < lower_bound or x > upper_bound]

# Example
data = [10, 12, 14, 15, 16, 100, 18, 20, 22, 24]
print(detect_outliers(data))

# Output: [100]
8. How would you generate random numbers following a normal distribution in Python?
You can generate random numbers following a normal distribution using numpy:
import numpy as np

# Generate 1000 random numbers following a normal distribution
random_numbers = np.random.normal(loc=0, scale=1, size=1000)

print(random_numbers[:5])  # Output: First 5 random numbers
The normal distribution is defined by:
$$f(x) = \frac{1}{\sqrt{2 \pi \sigma^2}} e^{-\frac{(x – \mu)^2}{2 \sigma^2}}$$
Where:
- μ is the mean.
- σ is the standard deviation.
9. Write a program to find the root of a quadratic equation.
Given a quadratic equation $ax2+bx+c=0ax^2 + bx + c = 0ax2+bx+c=0$, the roots can be found using the quadratic formula:
$$x = \frac{-b \pm \sqrt{b^2 – 4ac}}{2a}$$
import math

def quadratic_roots(a, b, c):
    discriminant = b**2 - 4*a*c
    if discriminant >= 0:
        root1 = (-b + math.sqrt(discriminant)) / (2*a)
        root2 = (-b - math.sqrt(discriminant)) / (2*a)
        return root1, root2
    else:
        return "Complex Roots"

# Example
a, b, c = 1, -3, 2  # x^2 - 3x + 2 = 0
print(quadratic_roots(a, b, c))

# Output: (2.0, 1.0)
10. How would you build a logistic regression model using scikit-learn?
Logistic regression is a binary classification algorithm. Here’s how to implement it using the scikit-learn library:
from sklearn.model_selection import train_test_split
from sklearn.linear_model import LogisticRegression
from sklearn.datasets import load_iris

# Load dataset
iris = load_iris()
X, y = iris.data, (iris.target == 0).astype(int)  # Binary classification (class 0 or not)

# Split data into train and test sets
X_train, X_test, y_train, y_test = train_test_split(X, y, test_size=0.2, random_state=42)

# Train the logistic regression model
log_reg = LogisticRegression()
log_reg.fit(X_train, y_train)

# Evaluate the model
accuracy = log_reg.score(X_test, y_test)
print(f"Logistic Regression Accuracy: {accuracy:.2f}")
The logistic regression model estimates the probability that a given input belongs to class 1 using the following sigmoid function:
$$P(y=1|x) = \frac{1}{1 + e^{-(\beta_0 + \beta_1 x_1 + \beta_2 x_2 + \dots + \beta_n x_n)}}$$
Conclusion
In this guide, we covered over 100 essential Data Science interview questions, ranging from basic concepts to advanced machine learning techniques and scenario-based problem-solving. We also addressed coding challenges, behavioral skills, and industry-specific questions that help prepare you for real-world Data Science interviews in 2025. By mastering these topics, you can confidently tackle a wide variety of interview questions. Continuous learning, staying updated with the latest trends, and practicing these questions will help you succeed in your Data Science career. Good luck!
References:
- Top Data Science Interview Questions and Answers (2024) – InterviewBit
- 10 Essential Data Science Interview Questions You Must Know | by Mily Smith | Medium
- Data science interview questions and answers