A data analyst is a professional responsible for collecting, organizing, and interpreting data to drive better business decisions. They act as a bridge between complex datasets and actionable insights, helping organizations identify trends, solve problems, and plan strategically.
In today’s rapidly evolving landscape, it’s not enough to master just technical skills—soft skills like communication, problem-solving, and critical thinking are equally crucial. Data analysts must combine technical proficiency with the ability to collaborate, present findings clearly, and adapt to new tools and technologies. Mastering a blend of these skills is key to thriving in the competitive field of data analytics in 2025.
Essential Technical Data Analyst Skills
Before diving into data interpretation and strategy, a data analyst must build a strong technical foundation. The following technical skills are crucial for handling large datasets, uncovering patterns, automating workflows, and presenting actionable insights accurately and efficiently.
1. SQL and Database Management
SQL (Structured Query Language) remains the backbone of data analytics. It allows data analysts to query, update, manipulate, and manage databases effectively. Every organization—whether a startup or an enterprise—relies heavily on structured data stored in relational databases.
SQL enables analysts to extract specific datasets, join tables, filter records, and even build complex reports.
Example use cases include analyzing a customer database to segment users based on purchase behavior, extracting sales records for specific time frames, or updating data quality issues within transactional systems.
Mastery of SQL ensures that data analysts can access raw data directly, saving time and ensuring accuracy in reporting and analysis.
2. Microsoft Excel and Spreadsheet Skills
Despite the rise of specialized tools, Microsoft Excel remains a critical skill for data analysts. It provides powerful functionalities like VLOOKUP, INDEX-MATCH, pivot tables, and macros that enable quick data analysis and reporting. Excel is especially useful for handling small to medium-sized datasets, conducting preliminary data cleaning, building financial models, and creating automated dashboards.
Its accessibility and versatility make it a go-to tool for ad-hoc reporting, trend analysis, and summarizing data insights before deeper statistical analysis is performed using more advanced programming languages.
3. Statistical Programming (R or Python)
Proficiency in programming languages like Python or R is increasingly expected for modern data analysts. These languages offer powerful libraries for data wrangling, statistical analysis, and machine learning.
- In Python, libraries like pandas, NumPy, and scikit-learn are essential for data manipulation, analysis, and building predictive models.
- In R, packages like dplyr, ggplot2, and caret allow for advanced statistical modeling and visualization.
Being comfortable with statistical programming enables analysts to handle larger datasets, automate repetitive tasks, perform sophisticated analysis, and create reproducible workflows—all of which are crucial for scaling data projects efficiently.
4. Probability and Statistics
A strong foundation in probability and statistics is non-negotiable for data analysts. These concepts form the basis of hypothesis testing, A/B testing, predictive modeling, and data-driven decision-making.
Understanding measures of central tendency, variance, distributions, p-values, confidence intervals, and regression helps analysts draw meaningful conclusions from data.
For example, when evaluating the effectiveness of a marketing campaign, knowledge of statistical significance ensures that the results aren’t due to random chance.
Statistical thinking enables analysts to design better experiments and interpret results more accurately, which is essential for guiding business strategy.
5. Data Visualization
Data visualization skills help analysts transform complex datasets into clear, compelling visual stories. Tools like Tableau, Power BI, matplotlib, and Seaborn enable the creation of dashboards, interactive charts, and insightful graphics.
Good visualization makes it easier for non-technical stakeholders to understand patterns, trends, and key takeaways quickly. Whether it’s summarizing sales performance, showcasing user behavior, or presenting forecasts, effective data storytelling drives better business decisions. Mastering visualization techniques is as important as statistical analysis for ensuring that the data’s message reaches the intended audience with maximum impact.
6. Machine Learning Basics
As companies increasingly value predictive insights, a basic understanding of machine learning is highly beneficial for data analysts.
Knowledge of beginner-friendly algorithms like linear regression, logistic regression, k-means clustering, and decision trees allows analysts to move beyond descriptive analysis toward predictive modeling. Understanding concepts like overfitting, model evaluation, and feature importance also prepares analysts to collaborate with data scientists and contribute to AI-driven projects. While deep expertise isn’t mandatory, familiarity with ML broadens an analyst’s skill set significantly.
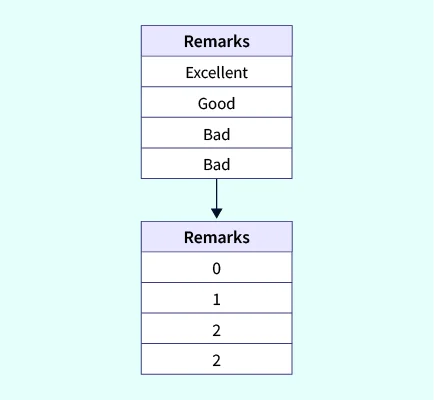
7. Data Management and Data Cleaning
A large part of a data analyst’s job involves cleaning and preparing data before analysis. Data often arrives messy—with missing values, duplicates, inconsistencies, or incorrect formats. Efficient data cleaning and preprocessing ensures higher model accuracy and reliable insights.
Analysts must know how to identify and correct issues through techniques like imputation, normalization, and outlier detection. Strong data management practices save time downstream, enhance the trustworthiness of results, and ensure compliance with data governance standards in larger organizations.
Key Soft Skills for Data Analysts
While technical skills form the backbone of a data analyst’s toolkit, soft skills are what make the insights useful, actionable, and impactful. These traits enable analysts to collaborate effectively, communicate findings clearly, and approach data with the precision and curiosity needed for real-world problem-solving.
8. Critical Thinking and Problem Solving
Critical thinking is the ability to question assumptions, connect patterns, and extract meaningful insights from raw data. Rather than just reporting trends, skilled analysts ask, “Why is this happening?” and “What should we do about it?”
Problem-solving involves structuring analysis workflows, testing hypotheses, and identifying root causes behind business issues. For example, if customer churn increases, a data analyst must go beyond metrics and investigate factors such as pricing changes, service disruptions, or user behavior shifts. Analysts with strong problem-solving skills can translate complex datasets into strategies that drive measurable improvements across business functions.
9. Communication and Data Storytelling
Great analysts don’t just uncover insights—they know how to communicate them effectively. This includes both written and verbal communication, as well as the ability to craft clear data stories tailored to specific audiences.
For stakeholders who may not understand technical jargon or statistical nuance, it’s important to present findings in a visually engaging and decision-focused manner. Whether it’s through a slide deck, dashboard, or executive summary, storytelling bridges the gap between data and action. Strong communicators ensure that insights lead to impact, not confusion.
10. Attention to Detail
Data analysis demands an unwavering attention to detail. Small mistakes in calculations, overlooked anomalies, or improperly cleaned data can lead to faulty conclusions that affect critical decisions.
From validating dataset integrity to checking statistical assumptions, a detail-oriented analyst ensures that every step—from data collection to reporting—is handled with precision. This skill is especially important when dealing with financial, healthcare, or compliance-sensitive data, where errors can have serious consequences. Meticulous analysts reduce risk, enhance data quality, and build trust in the insights they deliver.
Tips to Build and Improve Your Data Analyst Skills
Whether you’re starting your journey or aiming to level up, developing strong data analyst skills requires a mix of structured learning and hands-on experience.
1. Take Online Courses and Earn Certifications
Platforms like Coursera, edX, DataCamp, and Scaler offer comprehensive courses on SQL, Python, data visualization, machine learning, and more. Certifications from Google, Microsoft, or IBM can enhance credibility and signal your readiness to employers.
2. Build Portfolio Projects
A strong portfolio showcases your ability to apply analytical skills to real-world problems. Create projects like sales dashboard visualizations, churn prediction models, or A/B testing simulations. Use GitHub or personal blogs to share your work and explain your process clearly.
3. Practice with Real Datasets
Get hands-on by solving problems on Kaggle, Google Dataset Search, or government open data portals. Practice cleaning data, visualizing insights, and drawing actionable conclusions. Tackling diverse datasets improves both your technical agility and business intuition.
How to Highlight Data Analyst Skills on Your Resume?
Crafting a standout resume involves strategically showcasing your technical skills, certifications, and project impact.
- List Technical Skills and Tools Clearly: Create a dedicated “Skills” section where you mention tools like SQL, Python, Excel, Tableau, Power BI, R, and machine learning basics. Group them by categories (e.g., Programming, Visualization, Data Management) for clarity.
- Showcase Projects and Certifications: Highlight portfolio projects that demonstrate real-world problem-solving. Mention certifications (Google Data Analytics, Microsoft Power BI, etc.) prominently to boost credibility.
- Quantify Achievements: Use numbers to demonstrate impact. Example: “Analyzed customer churn data, reducing attrition by 12% through actionable insights.”
- Incorporate Relevant Keywords: Include keywords like “data cleaning,” “predictive modeling,” “dashboard reporting,” and “A/B testing” to pass Applicant Tracking Systems (ATS) filters and align with job descriptions.
Reference: