Data science is the backbone of innovation in today’s data-driven world, empowering businesses to make informed decisions, predict trends, and optimize operations. With applications spanning healthcare, finance, technology, and more, understanding the core components of data science is essential for anyone looking to enter this exciting field.
This article provides an easy-to-follow breakdown of the main components of data science, helping beginners gain clarity on how each part contributes to solving real-world problems. Whether you’re just starting your journey or exploring a new interest, this guide will equip you with the foundational knowledge to begin.
Main Components of Data Science
Data and Data Collection
Data is the foundation of data science. Without data, no insights or solutions can be derived. This component involves gathering, organizing, and ensuring the quality of data for analysis and decision-making.
1. Types of Data
- Structured Data: Organized data stored in rows and columns, such as databases. Examples include sales records and customer information.
- Unstructured Data: Data without a predefined format, like text, images, and videos.
- Semi-Structured Data: Partially organized data, such as JSON files or XML logs.
2. Data Sources
Data can come from multiple sources, including:
- Databases: Traditional systems like MySQL or PostgreSQL.
- APIs: Interfaces that allow applications to communicate and exchange data.
- Web Scraping: Extracting data from websites.
- IoT Devices: Sensors that generate real-time data.
3. Data Collection Methods
Common techniques for collecting data include:
- Surveys and Questionnaires: Gathering feedback directly from users.
- Sensors: Used in industries like manufacturing and healthcare to collect environmental or biometric data.
- Automated Tools: Scripts and software for gathering online data.
4. Challenges in Data Collection
- Data Privacy: Ensuring data is collected and used ethically, adhering to regulations like GDPR.
- Data Quality: Handling missing or inaccurate data to maintain reliability.
- Accessibility: Overcoming barriers to obtaining proprietary or restricted data.
Effective data collection ensures that subsequent steps in the data science process are built on reliable and meaningful information.
Data Engineering
Data engineering is the process of preparing and managing data to make it usable for analysis and modeling. This component ensures that raw data is transformed into clean, organized, and accessible datasets.
1. Data Cleaning and Preprocessing
- Handling Missing Values: Filling gaps in data using techniques like mean imputation or predictive modeling.
- Outlier Removal: Identifying and addressing anomalies that could distort results.
- Data Normalization: Scaling values to a consistent range for better model performance.
2. Data Storage Solutions
Efficient storage is essential for managing large datasets:
- Relational Databases: Use structured storage solutions like MySQL or PostgreSQL.
- NoSQL Databases: Store unstructured or semi-structured data in MongoDB or Cassandra.
- Data Lakes: Store raw data in its native format for scalability and flexibility.
3. Data Integration
- ETL (Extract, Transform, Load): Extract data from multiple sources, transform it into a usable format, and load it into a storage system.
- Tools: Popular ETL tools include Talend, Apache Nifi, and Informatica.
4. Data Pipeline Development
Automating workflows ensures data is processed efficiently:
- Batch Processing: Handling large volumes of data at scheduled intervals.
- Real-Time Pipelines: Processing data continuously for time-sensitive applications.
Example: In e-commerce, real-time pipelines help update inventory based on customer orders instantly.
By mastering data engineering, data scientists ensure that the data they work with is reliable, structured, and ready for analysis.
Statistics
Statistics is the backbone of data science, enabling data scientists to analyze and interpret data effectively. This component provides the tools to uncover patterns, test hypotheses, and make informed decisions based on data.
1. Descriptive Statistics
Descriptive statistics summarize and describe data features:
- Measures of Central Tendency: Mean, median, and mode provide insights into the data’s central point.
- Measures of Variability: Standard deviation and variance measure data spread and consistency.
Example: Calculating the average sales of a product to understand its performance.
2. Inferential Statistics
Inferential statistics help make predictions or generalizations about a population based on a sample:
- Hypothesis Testing: Determines whether observed differences are statistically significant.
- Confidence Intervals: Estimate the range within which a population parameter lies.
- P-Values: Indicate the probability of results occurring by chance.
Example: Testing whether a marketing campaign increased sales significantly.
3. Probability Theory
Probability is essential for understanding uncertainty in data:
- Distributions: Normal, binomial, and Poisson distributions model data behavior.
- Applications: Used in machine learning algorithms like Naive Bayes and Markov Chains.
4. Statistical Modeling
Statistical models predict or explain data behavior:
- Regression Analysis: Explores relationships between variables (e.g., linear and logistic regression).
- ANOVA (Analysis of Variance): Compares means across multiple groups.
- Time Series Analysis: Analyzes data points collected over time for trends and forecasting.
Example: A retail company using time series analysis to forecast holiday sales.
Mastering statistics enables data scientists to derive insights and validate findings with confidence, making it an indispensable component of data science.
Machine Learning
Machine learning is a critical component of data science, enabling systems to learn from data and make predictions or decisions without explicit programming. It forms the foundation for advanced analytics and artificial intelligence applications.
1. Supervised Learning
Supervised learning algorithms learn from labeled data to predict outcomes:
- Examples: Linear regression, logistic regression, decision trees, and support vector machines (SVM).
- Use Case: Predicting house prices based on features like size, location, and age.
2. Unsupervised Learning
Unsupervised learning identifies hidden patterns in unlabeled data:
- Examples: Clustering algorithms like k-means and hierarchical clustering, and dimensionality reduction techniques like PCA.
- Use Case: Customer segmentation in marketing to identify groups with similar behaviors.
3. Reinforcement Learning
Reinforcement learning focuses on training agents to make sequential decisions by maximizing rewards:
- Concepts: Agents, environments, actions, and reward systems.
- Use Case: Training robots to navigate environments or optimizing game strategies.
4. Model Evaluation Metrics
Evaluating machine learning models ensures reliability and accuracy:
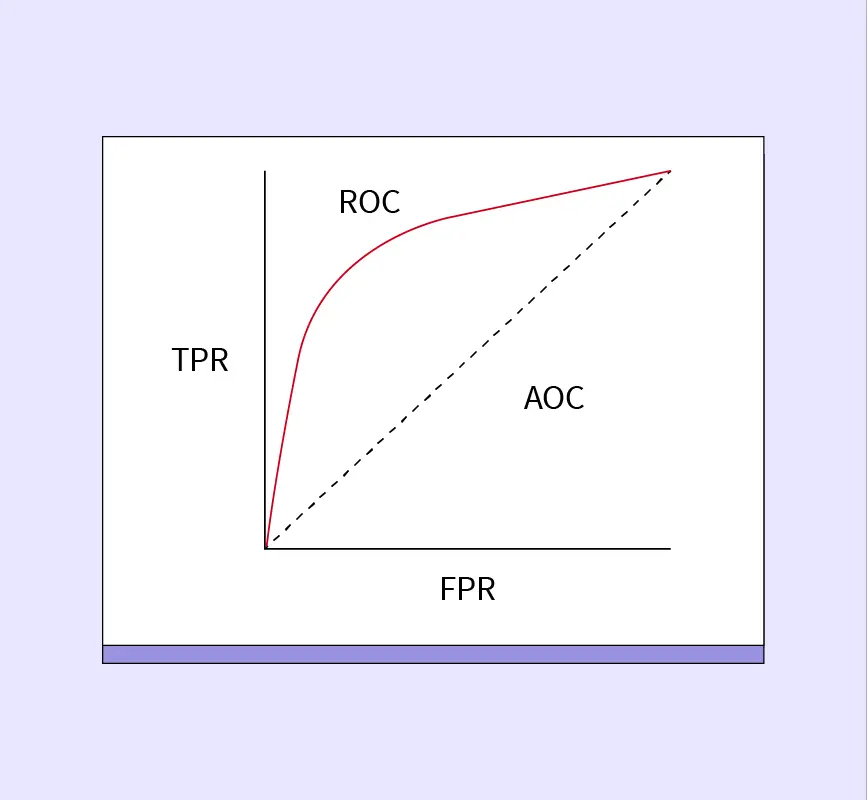
- Metrics: Accuracy, precision, recall, F1-score, and ROC-AUC.
- Use Case: Comparing models to choose the best one for fraud detection in banking.
Machine learning empowers data scientists to solve complex problems, from predicting outcomes to automating decision-making processes.
Programming Languages (Python, R, SQL)
Programming languages are essential tools for data scientists to manipulate, analyze, and interpret data effectively. Python, R, and SQL are the most commonly used languages in data science due to their versatility and functionality.
1. Python
Python is the go-to language for data science because of its simplicity and vast library ecosystem:
- Key Libraries:
- Pandas: Data manipulation and analysis.
- NumPy: Numerical computing.
- Scikit-learn: Machine learning implementation.
- Matplotlib/Seaborn: Data visualization.
- Use Case: Building predictive models or visualizing sales trends.
Fact: Python is used by over 50% of data scientists worldwide, making it the most popular language for data science.
2. R
R excels in statistical analysis and visualization:
- Key Features:
- Statistical modeling with packages like caret and randomForest.
- Visualization with ggplot2 and shiny.
- Use Case: Conducting advanced statistical tests or creating interactive visual dashboards.
3. SQL
SQL (Structured Query Language) is vital for interacting with databases:
- Functions: Querying, updating, and managing relational databases.
- Use Case: Extracting customer data from a company’s database to analyze purchase patterns.
4. Integration and Use Cases
Data scientists often use these languages together:
- Use Python for data preprocessing and model building.
- R for detailed statistical analysis.
- SQL for retrieving and managing data from relational databases.
Example: A data scientist might extract data using SQL, clean it using Python, and perform statistical analysis in R to generate business insights.
6. Big Data
Big data refers to the massive and complex datasets generated at high speed, which cannot be handled efficiently by traditional data processing systems. It forms an essential component of data science, enabling insights from vast and diverse data sources.
1. Definition and Characteristics
Big data is defined by the 5 Vs:
- Volume: Massive amounts of data generated daily (e.g., social media posts, IoT devices).
- Velocity: The speed at which data is generated and processed.
- Variety: Different types of data (structured, unstructured, semi-structured).
- Veracity: Ensuring data accuracy and reliability.
- Value: Extracting actionable insights from raw data.
2. Big Data Technologies
Technologies that enable processing and analyzing big data include:
- Hadoop: A distributed storage and processing framework.
- Spark: A fast, in-memory processing tool for large-scale data.
- NoSQL Databases: MongoDB and Cassandra for handling unstructured data.
3. Data Processing Frameworks
Big data processing requires specialized frameworks:
- MapReduce: Processes large datasets across distributed systems.
- Real-Time Processing: Tools like Apache Kafka handle continuous streams of data.
Example: An e-commerce platform using Kafka to process real-time user behavior and recommend products instantly.
4. Challenges and Solutions
- Scalability: Distributed systems like Hadoop enable handling of growing data volumes.
- Data Quality: Preprocessing ensures data is clean and usable.
- Integration: Tools like Apache Nifi streamline combining data from various sources.
Big data allows businesses to analyze patterns, predict trends, and make data-driven decisions on a massive scale, forming a cornerstone of modern data science.
Conclusion
Data science is a multifaceted field, and understanding its main components is essential for anyone aspiring to excel in it. From collecting and preparing data to leveraging machine learning and big data technologies, each component plays a vital role in extracting actionable insights from raw information.
- Key Takeaway: Data science combines data collection, engineering, statistics, machine learning, and programming to solve real-world problems.
- Future Trends: Emerging areas like AI integration, cloud computing, and quantum computing are poised to reshape the data science landscape.
If you’re eager to delve deeper into these components, start with a strong foundation in programming and statistics, and gradually explore advanced tools and techniques. Data science is a continuously evolving field, and staying updated will keep you ahead in this dynamic industry.


